forex software

Create and Test Forex Strategies

forex software

Skip to forum content

Forex Software

Create and Test Forex Strategies

You are not logged in. Please login or register.


(Page 13 of 62)

Forex Software → Market Analysis → InstaForex Analysis

Pages Previous 1 11 12 13 14 15 62 Next

You must login or register to post a reply

RSS topic feed

Posts: 301 to 325 of 1,547

Re: InstaForex Analysis

Technical analysis: Intraday Levels For EUR/USD, Apr 12, 2019

When the European market opens, some economic data will be released such as Industrial Production m/m. The US will also publish the economic data such as Treasury Currency Report, Prelim UoM Inflation Expectations, Prelim UoM Consumer Sentiment, Import Prices m/m, and Import Prices m/m, so amid the reports, the EUR/USD pair will move with low to medium volatility during this day.

TODAY'S TECHNICAL LEVELS:
Breakout BUY Level: 1.1315.
Strong Resistance: 1.1309.
Original Resistance: 1.1298.
Inner Sell Area: 1.1287.
Target Inner Area: 1.1261.
Inner Buy Area: 1.1235.
Original Support: 1.1224.
Strong Support: 1.1213.
Breakout SELL Level: 1.1207.

Analysis are provided by InstaForex

Best regards, PR Manager / Learn more about InstaForex Company at http://instaforex.com

Re: InstaForex Analysis

USD/CAD approaching support, potential bounce!

USDCAD is approaching our first support at 1.3295 (horizontal swing low support, short term ascending line) where a strong bounce might occur above this level pushing price up to our first resistance level at 1.3407 (horizontal swing high resistance, 61.8% Fibonacci extension , 61.8% Fibonacci retracement ). Stochastic is also approaching support where we might see a corresponding bounce in price.

Analysis are provided by InstaForex

Best regards, PR Manager / Learn more about InstaForex Company at http://instaforex.com

Re: InstaForex Analysis

XAG/USD approaching support, potential bounce!

XAGUSD is approaching our first support at 14.83 (horizontal pullback support, 61.8% Fibonacci extension , 61.8% retracement , short term ascending line) where a strong bounce might occur to our first resistance at 15.30 (horizontal overlap resistance, 61.8% Fibonacci retracement ). Stochastic is also approaching support where we might see a corresponding bounce in price. Trading CFDs on margin carries high risk. Losses can exceed the initial investment so please ensure you fully understand the risks.

Analysis are provided by InstaForex

Best regards, PR Manager / Learn more about InstaForex Company at http://instaforex.com

Re: InstaForex Analysis

GBP/USD approaching support, potential bounce!

GBPUSD is approaching our first support at 1.3000 (horizontal swing low support, 61.8% Fibonacci retracement , 61.8% Fibonacci extension ) where a strong drop might occur below this level to our first support level at 1.3136 (horizontal swing high resistance, 38.2% Fibonacci retracement ).

Stochastic is also approaching support where we might see a corresponding bounce in price.

Trading CFDs on margin carries high risk.

Losses can exceed the initial investment so please ensure you fully understand the risks.

Analysis are provided by InstaForex

Best regards, PR Manager / Learn more about InstaForex Company at http://instaforex.com

Re: InstaForex Analysis

NZD/USD approaching support, potential bounce!

NZDUSD is approaching our first support at 0.6672 (horizontal swing low support, 61.8% Fibonacci extension . Descending channel support) where a strong bounce to our major resistance at 0.6741 (horizontal overlap resistance, 61.8% Fibonacci retracement ) might occur. Stochastic is approaching support as well.

Trading CFDs on margin carries high risk.

Losses can exceed the initial investment so please ensure you fully understand the risks.

Analysis are provided by InstaForex

Best regards, PR Manager / Learn more about InstaForex Company at http://instaforex.com

Re: InstaForex Analysis

XAU/USD approaching support, potential bounce!

XAUUSD is approaching our first support at 1275.34 (horizontal swing low support, 38.2% Fibonacci retracement , 100% Fibonacci extension ) where a strong bounce might occur above this level pushing price up to our major resistance at 1308.70 (horizontal swing high resistance, 50% Fibonacci retracement ).

Stochastic is also approaching support where we might see a corresponding bounce in price.

Trading CFDs on margin carries high risk.

Losses can exceed the initial investment so please ensure you fully understand the risks.

Analysis are provided by InstaForex

Best regards, PR Manager / Learn more about InstaForex Company at http://instaforex.com

Re: InstaForex Analysis

CAD/JPY broke key support with strong bearish pressure from Ichimoku cloud, expect further drop!

https://forex-images.ifxdb.com/userfiles/20190424/analytics5cbfcdec0346c.png

Company does not offer investment advice and the analysis performed does not guarantee results

Entry : 83.48
Why it's good : horizontal pullback resistance, 23.6% fibonacci retracement Stop Loss : 83.63
Why it's good : horizontal pullback resistance, 38.2% fibonacci retracement Take Profit : 82.69
Why it's good : horizontal pullback support, 61.8% fibonacci retracement

Analysis are provided byInstaForex.

Best regards, PR Manager / Learn more about InstaForex Company at http://instaforex.com

Re: InstaForex Analysis

The US following China may surprise markets with unexpectedly high GDP growth in the first quarter

The latest temporary government shutdown, trade conflicts and a slowdown in global growth — against this background, the prospects for the first quarter for the US economy did not look promising. However, GDP data for the first three months of 2019 may surprise. After the Chinese economy unexpectedly grew during this period, it is expected that the United States will see a growth of 2.1 percent, although previously the range of analysts' estimates began from 1 percent. In the forecasts of the Atlanta Fed, the range is even more optimistic, between 2.2 and 3.4 percent. If recently most experts spoke about the weakness of the US economy, now they are expecting strong growth in the first quarter. In addition, companies have increased investment, in March, retail sales in the country grew at the fastest rate in 1.5 years - all opposed to the version of the beginning of a recession.

The unexpected reduction in the US trade deficit in February is also evidence of higher growth rates, and only weak production volumes — recall the recent first quarterly decline in industrial output after the election of Donald Trump — can explain such a wide range of estimates.

News are provided by InstaForex

Best regards, PR Manager / Learn more about InstaForex Company at http://instaforex.com

Re: InstaForex Analysis

GBP/CHF reversed off key resistance, expect further drop!

Company does not offer investment advice and the analysis performed does not guarantee results

Entry : 1.3267
Why it's good : horizontal overlap resistance, 61.8% fibonacci retracement, 61.8% Fibonacci extension
Stop Loss : 1.3430
Why it's good : horizontal swing high resistance
Take Profit : 1.2955
Why it's good : horizontal swing low support, 61.8% fibonacci extension

Analysis are provided by InstaForex

Best regards, PR Manager / Learn more about InstaForex Company at http://instaforex.com

Re: InstaForex Analysis

Technical analysis of EUR/USD for 26/04/2019

Technical Market Overview:

The EUR/USD market is now consolidating in a narrow range between the levels of 1.1118 - 1.1145 after the downtrend has passed a for a while due to the oversold market conditions. The momentum remains weak anyway and there is no sign of any trend reversal yet. The first important technical resistance is seen at the level of 1.1176 and the next technical support is seen at the level of 1.1109 and 1.1027.

Weekly Pivot Points:
WR3 - 1.1384
WR2 - 1.1352
WR1 - 1.1289
Weekly Pivot - 1.1254
WS1 - 1.1188
WS2 - 1.1157
WS3 - 1.1092

Trading recommendations:
The last take profit level at 1.1118 has been hit and all sell orders should be closed with profit. The traders should now wait for another trading setup to occur shortly.

Analysis are provided by InstaForex

Best regards, PR Manager / Learn more about InstaForex Company at http://instaforex.com

Re: InstaForex Analysis

NZD/USD approaching key resistance, potential reversal!

Price is facing bearish pressure from our first resistance where we can expect a drop below this level to our first support level. Stochastic is approaching resistance as well.

Entry : 0.6717
Why it's good : horizontal pullback resistance, 38.2% fibonacci retracement, 61.8% Fibonacci extension
Stop Loss : 0.6775
Why it's good : horizontal swing high resistance, 50% fibonacci retracement
Take Profit : 0.6585
Why it's good : horizontal swing low support

News are provided by InstaForex

Best regards, PR Manager / Learn more about InstaForex Company at http://instaforex.com

Re: InstaForex Analysis

EUR/USD testing key resistance, potential reversal!

Price is facing bearish pressure from our first resistance where we can expect a drop below this level to our first support level. Stochastic is approaching resistance as well.

Entry : 1.1190
Why it's good : horizontal pullback resistance, 23.6%, 38.2% fibonacci retracement, 61.8% Fibonacci extension
Stop Loss : 1.1225
Why it's good : horizontal overlap resistance, 50% fibonacci retracement Take Profit : 1.1124
Why it's good : horizontal swing low support

Analysis are provided by InstaForex

Best regards, PR Manager / Learn more about InstaForex Company at http://instaforex.com

Re: InstaForex Analysis

Gold price inability to break above resistance will lead prices towards $1,260.

Gold price as expected since $1,270 has bounced for a back test of the major support area of $1,280-90. Now there are a lot of chances that the entire back test is over as bulls remain too weak to break above $1,290-$1,300. The next leg down should follow soon.

Blue line - major resistance trend line
Red line -RSI support trend line
Red rectangle - major confluence area of resistance (previous support)

Gold price remains below the blue trend line resistance and shows rejection signs once again at the red rectangle area that is now resistance and was once support. Inability by the bulls to recapture the $1,280-90 level is a bearish sign. Since this support area was broken we said that we expect prices to move lower towards $1,250-60. Price fell as low as $1,266 and we said expect a back test and then maybe another move lower. As long as price is below $1,300 we continue to expect prices to move lower towards $1,250-60 or even lower. Any bounce is considered a selling opportunity. Gold should see $1,250-60 if price breaks below $1,270.

Analysis are provided by InstaForex

Post's attachments

11.JPG 49.62 kb, file has never been downloaded. 

You don't have the permssions to download the attachments of this post.
Best regards, PR Manager / Learn more about InstaForex Company at http://instaforex.com

Re: InstaForex Analysis

Forecast for EUR/USD on May 3, 2019

EUR/USD

On Thursday, the dollar strengthened, adding 0.2% to the index, which was facilitated by good data on the growth of factory orders – the March figure grew by 1.9% against expectations of 1.0%. The euro lost 22 points, eventually gaining support from the four-hour balance line. The Marlin oscillator on H4 indicates a further decrease in the trend.

Today, the main news will be data on employment in the United States. The increase in jobs outside the agricultural sector in April is expected to be 181 thousand, the average hourly wage may grow by 0.3%, business activity in the non-production sector from ISM is expected to be 57.2 against 56.1 a month earlier.

But in the afternoon, the European CPI is set to be released, and here the forecasts are also optimistic; The base CPI for April is expected to be 1.0% y/y against 0.8% in March, the overall CPI is 1.6% against 1.4% earlier.

The minimum task for the euro today is to consolidate below the level of 1.1155, with fresh forces next week to continue the decline to 1.1075 and 1.0985. The target levels are determined by the Fibonacci grid of the daily chart.

https://lh5.googleusercontent.com/Lkj-0MKqYBACUIodoZRXoee4RhEBMKwlJOnaxWDuS01bxOwEuFbTE4nuXHapJHFy2imv2Abi_FZzzYhtJHL6xrHWdI9-3-UgUoyrSZQgWP_98Qm_GjzpOXOtT2cOPlRg9aA-qLXt

https://lh5.googleusercontent.com/mDEV2h2U0HcLchfc9Q0mG1Y3zlGXa36gI912SaqXhMR1smUWAP5fplKTP_ORoLUfKLhHVBAY_Y0RbAEuItxPhC8NvFRsv4tIyk-IblneTScQ9T0qUF1vE-jqCh3rqcbaiXs2g5eG

*The market analysis posted here is meant to increase your awareness, but not to give instructions to make a trade.

Best Regards,PR Manager
InstaForex Companies Group

Re: InstaForex Analysis

Technical analysis of Bitcoin for 06.05.2019

Crypto Industry News:

68% of people with high incomes from around the world have already invested or are planning to invest in the crypto until the end of 2022, according to a survey conducted by the Dubai company deVere Group.

DeVere Group has over $ 10 billion in assets under the supervision and over 80,000 customers located in 100 countries.

More than two-thirds of people from around the world, whose value of assets is equivalent to or greater than 1 million British pounds, will invest in cryptocurrencies, such as Bitcoin, Ethereum and XRP. The new study involved more than 700 deVere customers located in major countries around the world, such as the United States, the United Kingdom, Australia, Japan, Qatar, Switzerland, Mexico, Hong Kong, Spain, France, Germany, South Africa, and the United Arab Emirates.

Technical Market Overview:

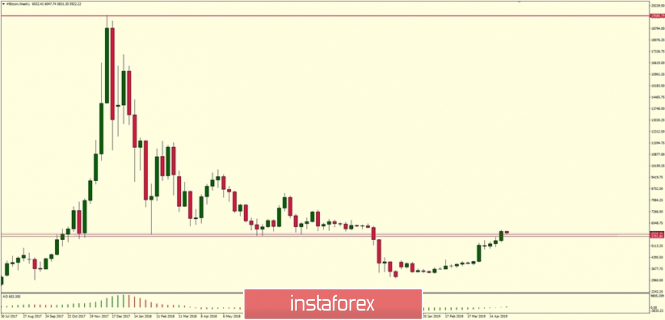
The BTC/USD pair has broken above the important technical resistance zone located between the levels of $5,701 - $5,839. Moreover, at the weekly timeframe chart, the price has made a green bullish candle that closed away from the technical resistance zone, around the level of $6,106. This is a solid and important technical clue for all bulls that the up move is still strong and the Bitcoin is on its way to the much higher price levels.

Weekly Pivot Points:

WR3 - $7,123
WR2 - $6,689
WR1 - $6,362
Weekly Pivot - $5,868
WS1 - $5,578
WS2 - $5,080
WS3 - $4,863

Trading Recommendations:

The bigger time frame charts are now indicating a possible trend change from bearish to bullish, so only a buy positions should be open on the local corrective pull-backs. The nearest level to open the buy order is located at the top of the support zone at $5,729.

https://forex-images.ifxdb.com/userfiles/20190506/analytics5ccfc36fe6c89.jpg

*The market analysis posted here is meant to increase your awareness, but not to give instructions to make a trade.

Best Regards,PR Manager
InstaForex Companies Group

Re: InstaForex Analysis

Aussie messed up the policy

Following Donald Trump, other representatives of the US administration called on the Fed to lower the Federal funds rate. Vice President Michael Pence and chief economic adviser to the head of state Larry Kudlow believe that the economy works very well and the time has come to further disperse it by easing monetary policy. However, the US central bank has not yet followed the White House. Moreover, his colleagues from Australia have the best chance of monetary expansion. According to estimates of the derivatives market, the likelihood that the RBA will reduce the cash rate to a record low of 1.25% at the May meeting, is at 50: 50. It is interesting that even here it can not do without pressure from politicians.

Australia will have Parliamentary elections on May 18, and regardless of who comes to power (for now, according to opinion polls, Labor is in the lead), the new government will focus on stimulating monetary and fiscal policies. A significant slowdown in GDP growth in the second half of 2018, cooling of retail sales and a fall in real estate prices require increasing consumer activity. It is possible that the Reserve Bank will become a hostage of the current ruling party. 17 out of 42 experts polled by Reuters expect that at a meeting on May 7 it will reduce the cash rate by 25 bp. Most experts believe that by the end of the year the rate may fall to 1% against the background of a significant slowdown in inflation.

Australian Inflation Dynamics and RBA Rates

It should be noted that in recent months, the RBA's outlook has changed significantly. If in December Philip Lowe said that monetary policy could be tightened for the first time since 2010, in February he focused on keeping the rate at 1.5%, by April he began to hint at monetary expansion. If it does happen, the RBA will be the first central bank of a developed country to decide to reduce borrowing costs. According to AMP Capital, the beginning of the monetary easing cycle will lead to the peak of AUD/USD to 0.6.

While the "bears" on the aussie rely on the weakness of the Australian economy, "bulls", on the contrary, adopt external factors. BofA Merrill Lynch sees the analyzed pair at 0.78 by the end of the year, Goldman Sachs recommends buying it as the Chinese economy recovers. Even the best forecaster of Bloomberg, during the end of the first quarter Tempus Inc expects the growth of AUD/USD to 0.74 by the end of 2019. Donald Trump, who announced an increase in tariffs for imports from China, could spoil the karma for aussie fans. The market was confident that Beijing and Washington were about to sign the deal, but such threats undermined this belief, contributing to the deterioration of the global risk appetite.

Technically, the implementation of the "Expanding wedge" and AB=CD patterns reinforces the risks of continuing the Australian dollar's downward hike to the target by 161.8% according to the latest model. It corresponds to $0.687.

Analysis are provided by InstaForex

Best regards, PR Manager / Learn more about InstaForex Company at http://instaforex.com

Re: InstaForex Analysis

Brent: in war as in war

When pursuing many goals, you need to be prepared for the fact that they will begin to contradict each other. With a statement about raising tariffs from 10% to 25% for $200 billion worth of Chinese imports from May 10, Donald Trump brought Brent and WTI down by more than 2%, but at the same time strengthened the dollar (safe-haven asset) against currencies of developing countries (risky assets) . The risks of escalating the trade conflict between the United States and China, the two countries, which account for one-third of global oil consumption, led to a swift attack on black gold, but information about the United States sending bombers and aircraft carriers to the Middle East messed up all the cards.

The White House wants to punish Iran by reducing its oil exports to zero, but is unhappy with the growth of Brent and WTI quotes. Threats to Tehran to block the Strait of Hormuz, which will create serious supply disruptions, force Americans to demonstrate military force. At the same time, the growth of geopolitical tensions is a "bullish" factor for black gold. Try to make both goals accomplished at the same time!

The problem with China is as difficult. Trump declares that the United States annually loses $600-800 billion from trade, of which $500 billion falls on China. This can no longer continue! But excuse me, historically, the US is a consumer country. The better their economy feels, the faster the import grows and the trade balance deficit widens. At the same time, threats to raise tariffs from May 10 and then impose the entire Chinese imports on them provoked a 6% collapse of the Shanghai Composite on fears of a slowdown in the largest Asian economy. If there is no V-shaped recovery in China's GDP, then one of the key drivers of growth of world stock indices and oil will disappear, triggering them into a deep correction.

Dynamics of the Chinese stock and oil market

Donald Trump will be pleased to rub his hands over the rollback of Brent and WTI, but the S&P 500's fall is unlikely to please him . At the same time, the dollar will strengthen, which the White House also does not want. The goals of the US president are often contradictory, but they can still be achieved. For example, during the trade war, China reduced the import of American oil from 430 thousand b/d to 100 thousand b/d. Potentially, thanks to the negotiations, not only will it return the previous figures, but also increase them by $12 billion a year.

In my opinion, the further fate of Brent and WTI will depend on two factors: a trade war and a prolongation of the agreement between OPEC and other producing countries on reducing production. The signing of an agreement on the contract of trade friction between Washington and Beijing, as well as the extension of the terms of the obligations of the cartel and Russia will make it possible for oil to continue the rally. On the contrary, the escalation of the conflict between the largest economies of the world and the increase in world production will launch a serious correction in the oil market. Technically, this can be expressed in the growth of quotations of futures for the North Sea variety above the resistance by $72.75 and $75.65, or in their fall below the support by $68.45 per barrel as part of the transformation of the "Shark" pattern in 5-0.

Analysis are provided by InstaForex

Best regards, PR Manager / Learn more about InstaForex Company at http://instaforex.com

Re: InstaForex Analysis

EUR/USD approaching resistance, potential reversal!

Price is approaching resistance where we might see a corresponding drop in price to our first support level.
Entry : 1.12270
Why it's good : horizontal overlap resistance, 61.8% Fibonacci extension, 38.2% Fibonacci retracement
Stop Loss : 1.1277
Why it's good : 76.4% Fibonacci retracement, pullback retracement
Take Profit : 1.1144
Why it's good : horizontal swing low support, 61.8% Fibonacci extension

Analysis are provided by InstaForex

Best regards, PR Manager / Learn more about InstaForex Company at http://instaforex.com

Re: InstaForex Analysis

EUR/GBP approaching resistance, potential reversal!

Price is approaching resistance where we might see a corresponding drop in price to our first support level.
Entry : 0.8587
Why it's good : horizontal overlap resistance, 78.6% Fibonacci retracement Stop Loss : 0.8679
Why it's good : horizontal swing high resistance
Take Profit : 0.8587

Analysis are provided by InstaForex

Best regards, PR Manager / Learn more about InstaForex Company at http://instaforex.com

Re: InstaForex Analysis

GBP/USD approaching support, potential bounce!

https://forex-images.ifxdb.com/userfiles/20190509/analytics5cd389badb9f7.png

Price is approaching support where we are expecting a bounce above this level.
Entry : 1.2930
Why it's good : 78.6% Fibonacci retracement, 61.8% Fibonacci extension Stop Loss : 1.2861
Why it's good : horizontal swing low support
Take Profit : 1.3053 Why it's good : horizontal overlap resistance, 50% Fibonacci retracement

Analysis are provided byInstaForex.

Best regards, PR Manager / Learn more about InstaForex Company at http://instaforex.com

Re: InstaForex Analysis

USD/CHF reversed off resistance, potential for further drop

Price reversed from our first resistance where there is potential for further drop.
Entry : 1.0095 Why it's good : 23.6% Fibonacci retracement, 61.8% Fibonacci extension
Stop Loss : 1.0123
Why it's good : horizontal overlap resistance, 100% Fibonacci extension, 38.2% Fibonacci retracement
Take Profit : 1.0008
Why it's good : horizontal overlap support, 61.8% Fibonacci retracement, 61.8% Fibonacci extension

Analysis are provided by InstaForex

Best regards, PR Manager / Learn more about InstaForex Company at http://instaforex.com

Re: InstaForex Analysis

EUR/USD 3 Star Sell Signal | Fundamental + Technical Analysis

Fundamentals: Heightened transatlantic tensions drove the currency lower as EU is ready to retaliate against $23 billion of US goods with US auto tariffs deadline of 18 May approaching. Those duties would be based on the same national - security grounds invoked for controversial American levies on foreign steel and Aluminum. US tariffs on European cars and auto parts will mark a significant escalation of transatlantic tensions because the value of EU automotive exports to the America market is about 10 times greater than that of the bloc's steels and aluminum exports combined. Hence, if the auto tariffs are imposed, EU retaliatory duties would target a bigger amount of US exports to Europe. Elsewhere, Italian 2 year yield rose sharply while EUR plummeted on as Italy Deputy Prime Minister Matteo Salvini said the nation is ready to break EU fiscal rules if necessary to boost employment.

Technical analysis:

Price is starting to break an ascending support line and we expect it to drop further to 1.1180. It reacted perfectly from our resistance level yesterday and is on track to reaching its profit target.

Analysis are provided by InstaForex

Best regards, PR Manager / Learn more about InstaForex Company at http://instaforex.com

Re: InstaForex Analysis

Technical analysis of GBP/USD for 17/05/2019:

Technical Market Overview:
There is no rest for the bears on the GBP/USD pair as the market keeps doing the lower lows in the downtrend despite the extremely oversold conditions. The price just recently hit the technical support at the level of 1.2788 after a series of down candles were made in order the break out of the channel. The momentum is still weak and negative, so the next target for bears is located at the level of 1.2772.
Weekly Pivot Points: WR3 - 1.3288
WR2 - 1.3229 WR1 - 1.3095
Weekly Pivot - 1.3031
WS1 - 1.2885
WS2 - 1.2821
WS3 - 1.2676

Trading Recommendations:
The market is moving below the trendline, so the best trading strategy for daytraders is to open the sell orders during the local pull-backs. All the targets for this week have been hit already, so. please pay attention to the price action signs of reversal and candlestick patterns at the range support and range resistance to confirm the level for the trading position.

Analysis are provided by InstaForex

Best regards, PR Manager / Learn more about InstaForex Company at http://instaforex.com

Re: InstaForex Analysis

Control zones NZDUSD 05/20/19

The downward movement is a medium-term impulse, so selling is still a priority. It is not profitable to sell on Monday from current grades, since the target of the fall is the weekly CZ of 0.6470-0.6456. Any growth should be used as an opportunity to sell the pair. The first resistance will be WCZ 1/4 06545-0.6542.

The downward trend is so strong that it will be possible to look for opportunities for buying only if a daily absorption takes place and the US session closes above Friday's maximum. This model will be the starting point in the formation of a deep correctional model, the next goal of which will be WCZ 1/2 0.6584-0.6577. While the pair will be trading below the specified zone, the bearish trend will not turn.

Daily CZ - daily control zone. The area formed by important data from the futures market, which change several times a year.

Weekly CZ - weekly control zone. The zone formed by important marks of the futures market, which change several times a year.

Monthly CZ - monthly control zone. The zone, which is a reflection of the average volatility over the past year.

Analysis are provided by InstaForex

Best regards, PR Manager / Learn more about InstaForex Company at http://instaforex.com

Re: InstaForex Analysis

Technical analysis of EUR/USD for 21.05.2019

https://forex-images.ifxdb.com/userfiles/20190521/analytics5ce38a8c4626d.jpg

Technical Market Overview:
After making the local low at the level of 1.1150, the EUR/USD pair has tried to bounce or even rally higher, but this attempt was capped at the technical resistance zone located between the levels of 1.1167 - 1.1173 and the price reversed. The short-term outlook remains bearish and there is no signs or any trend reversal for now. The next target for bears is seen at the level of 1.1111.

Weekly Pivot Points:
WR3 - 1.1317
WR2- 1.1287
WR1 - 1.1208
Weekly Pivot - 1.1178
WS1 - 1.1099
WS2 - 1.1069
WS3 - 1.0986

Trading Recommendations:
The best trading strategy in the current market conditions is to sell the local pull-backs with a tight protective stop loss. Due to the oversold market conditions please pay attention to the candlestick trend reversal patterns and market trend reversal patterns. The next important technical support is located at the level of 1.1111 and this is the next target for bears.

Analysis are provided byInstaForex.

Best regards, PR Manager / Learn more about InstaForex Company at http://instaforex.com

Posts: 301 to 325 of 1,547

Pages Previous 1 11 12 13 14 15 62 Next

You must login or register to post a reply

Forex Software → Market Analysis → InstaForex Analysis

Similar topics in this forum