forex software

Create and Test Forex Strategies

forex software

Skip to forum content

Forex Software

Create and Test Forex Strategies

You are not logged in. Please login or register.


(Page 41 of 41)

Forex Software → Market Analysis → Technical Analysis by FXOpen

Pages Previous 1 39 40 41

You must login or register to post a reply

RSS topic feed

Posts: 1,001 to 1,009 of 1,009

1,001

Re: Technical Analysis by FXOpen

Watch FXOpen's May 15 - 19 Weekly Market Wrap Video

Get the latest scoop on the week's hottest headlines, all in one convenient video. Join Gary Thomson, the COO of FXOpen UK, as he breaks down the most significant news reports and shares his expert insights.

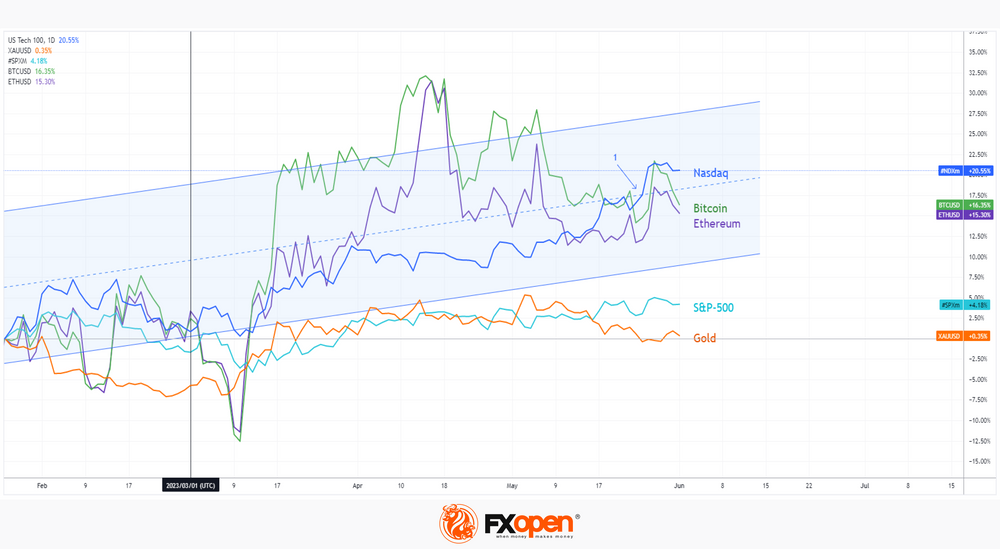
  • Buckle up for the rise of E-mini Nasdaq 100 Futures, hitting the year's highest peak so far

  • Brace yourself for the unthinkable: US Default. Explore the captivating question of what direction the markets might take if the US Government runs out of money and discover the top 3 assets to keep an eye on. It's time to strategize!

  • Crude Oil Analysis: Is the industry running on empty, or are there surprising turns ahead? Find out now!

Watch our short and informative video, and stay updated with FXOpen.

https://i.postimg.cc/mg4V7Ss5/img-009.png

FXOpen YouTube


Disclaimer: This article represents the opinion of the Companies operating under the FXOpen brand only. It is not to be construed as an offer, solicitation, or recommendation with respect to products and services provided by the Companies operating under the FXOpen brand, nor is it to be considered financial advice.

#fxopen #fxopenyoutube #fxopenuk #weeklyvideo

1,002

Re: Technical Analysis by FXOpen

GBP/USD Struggles Below 1.2500 While EUR/GBP Remains at Risk
https://i.postimg.cc/VN7SR1Ts/gbp.png

GBP/USD is struggling to clear the 1.2500 resistance zone. EUR/GBP is now consolidating losses below the 0.8700 resistance.

Important Takeaways for GBP/USD and EUR/GBP Analysis Today

  • The British Pound is trading in a bearish zone below 1.2500 against the US Dollar.

  • There was a break above a key bearish trend line with resistance near 1.2445 on the hourly chart of GBP/USD at FXOpen.

  • EUR/GBP started a fresh decline from the 0.8710 resistance zone.

  • There is a major bearish trend line forming with resistance near 0.8700 on the hourly chart at FXOpen.

GBP/USD Technical Analysis
https://i.postimg.cc/PqfpYNSF/gbpx.jpg

On the hourly chart of GBP/USD at FXOpen, the pair started a major decline from well above 1.2520. The British Pound traded below the 1.2500 support zone against the US Dollar.

The pair tested the 1.2390 support zone. A low was formed near 1.2391 and recently the pair started a fresh increase. There was a decent move above the 50-hour simple moving average at 1.2445. More importantly, there was a break above a key bearish trend line with resistance near 1.2445.

Finally, it spiked above the 61.8% Fib retracement level of the downward move from the 1.2510 swing high to the 1.2391 low. The GBP/USD chart indicates that the pair is facing resistance near the 1.2475 level.

The 76.4% Fib retracement level of the downward move from the 1.2510 swing high to the 1.2391 low is also near 1.2445. The next major resistance is near the 1.2500 level. A clear move above the 1.2500 level could spark a rally toward the 1.2540 level considering the RSI is above 50.

On the downside, there is a major support forming near the 1.2445 level. If there is a downside break below the 1.2445 support, the pair could accelerate lower.

The next major support is near the 1.2390 level, below which the pair could test 1.2350. In the stated case, GBP/USD may perhaps revisit the 1.2320 support. Any more losses could lead the pair toward the 1.2250 support.

VIEW FULL ANALYSIS VISIT - FXOpen Blog...

Disclaimer: This article represents the opinion of the Companies operating under the FXOpen brand only. It is not to be construed as an offer, solicitation, or recommendation with respect to products and services provided by the Companies operating under the FXOpen brand, nor is it to be considered financial advice.

1,003

Re: Technical Analysis by FXOpen

BTCUSD Analysis: Bullish Harami Pattern Above $26,394
https://i.postimg.cc/Qtr4pNpp/btc.png

Bitcoin’s price continues its bullish momentum from last week, and after touching a low of USD 26,394 on May 18, we can see a move towards a consolidation phase, after which we are expecting upsides in the range of USD 28500 and USD 29000.

On the hourly chart:

  • We can clearly see a bullish Harami pattern above the USD 26,394 handle.

  • Both the STOCH and Williams’s percent range indicate overbought levels, which means that in the immediate short term, a decline in the price is expected.

  • The resistance of the channel is broken.

  • The relative strength index is at 63.84, indicating a strong demand for Bitcoin and the continuation of the buying phase in the markets.

  • Most of the major technical indicators are giving a bullish signal, which means that in the immediate short term, we are expecting targets of USD 28,000 and USD 28,500.

  • Bitcoin’s price is now moving above its 100-hour simple moving average and its 100-hour exponential moving average.

  • The average true range indicates low market volatility with mild bullish momentum.

https://i.postimg.cc/J4dpp5N7/btcx.png

VIEW FULL ANALYSIS VISIT - FXOpen Blog...

Disclaimer: This article represents the opinion of the Companies operating under the FXOpen brand only. It is not to be construed as an offer, solicitation, or recommendation with respect to products and services provided by the Companies operating under the FXOpen brand, nor is it to be considered financial advice.

1,004

Re: Technical Analysis by FXOpen

XRPUSD Analysis: Three White Soldiers Pattern Above $0.4441
https://i.postimg.cc/1tY7dk2t/xrp.png

Last week, the market sentiment remained indecisive after Ripple price touched a low of USD 0.4441 on May 18 and started to correct upwards, with the prices ranging near a new record high of 1 month.

On the hourly chart:

  • The relative strength index is at 53.20, which signifies a neutral demand for Ripple at the current market price and the continuation of the consolidation phase in the market.

  • Moving averages signal an upwards price movement at the current market level of 0.4609.

  • The ADX and CCI are both in the neutral zone, which means the price is expected to consolidate further.

  • Ripple is now trading just below its pivot level of 0.4628 and is facing its classic resistance at 0.4660 and Fibonacci resistance at 0.4705, after which it will be able to move towards 0.4900.

  • The Ichimoku price is over the cloud, indicating a bullish market.

  • Bullish price crossover seen with moving averages MA20 and MA50.

https://i.postimg.cc/hvzZRCR0/xrpx.png

VIEW FULL ANALYSIS VISIT - FXOpen Blog...

Disclaimer: This article represents the opinion of the Companies operating under the FXOpen brand only. It is not to be construed as an offer, solicitation, or recommendation with respect to products and services provided by the Companies operating under the FXOpen brand, nor is it to be considered financial advice.

1,005

Re: Technical Analysis by FXOpen

EUR/USD Turns Red, USD/CHF Bulls in Control
https://i.postimg.cc/MTdv3zpj/eur.png

EUR/USD started a fresh decline from the 1.0830 resistance. USD/CHF is rising and might aim a move toward the 0.9060 resistance.

Important Takeaways for EUR/USD and USD/CHF Analysis Today

  • The Euro struggled to clear the 1.0845 resistance against the US Dollar.

  • There is a major bearish trend line forming with resistance near 1.0800 on the hourly chart of EUR/USD at FXOpen.

  • USD/CHF is gaining pace above the 0.9000 resistance zone.

  • There is a key bearish trend line forming with resistance near 0.9020 on the hourly chart at FXOpen.

EUR/USD Technical Analysis
https://i.postimg.cc/3rfkgrqs/eurx.png

On the hourly chart of EUR/USD at FXOpen, the pair faced rejection near 1.0830. The Euro started a fresh decline from the 1.0828 swing high against the US Dollar.

There was a move below the 50-hour simple moving average at 1.0800. The pair tested the 1.0765 support. A low is formed near 1.0760 and the pair is now correcting losses. It is slowly moving higher above the 23.6% Fib retracement level of the recent decline from the 1.0828 swing high to the 1.0760 low.

Immediate resistance on the upside is near the 50-hour simple moving average at 1.0790. It is close to the 50% Fib retracement level of the recent decline from the 1.0828 swing high to the 1.0760 low.

The first major resistance is a major bearish trend line at 1.0810. An upside break above the 1.0810 level might send the pair toward the 1.0845 resistance. The next major resistance is near the 1.0900 level. Any more gains might open the doors for a move toward the 1.0920 level.

If there is no move above 1.0810 and RSI stays below 50, the pair might start a fresh decline. On the downside, immediate support on the EUR/USD chart is seen near 1.0765.

The next major support is near the 1.0750 level. A downside break below the 1.0750 support could send the pair toward the 1.0720 level.

VIEW FULL ANALYSIS VISIT - FXOpen Blog...

Disclaimer: This article represents the opinion of the Companies operating under the FXOpen brand only. It is not to be construed as an offer, solicitation, or recommendation with respect to products and services provided by the Companies operating under the FXOpen brand, nor is it to be considered financial advice.

1,006

Re: Technical Analysis by FXOpen

ETHUSD Analysis: Bearish Harami Pattern below $1,871
https://i.imgur.com/L22KpmY.png

Bulls couldn’t take control of the market, and after touching a high of $1,871 on 23 May, the ETH/USD pair is moving in a bearish trend, touching a low of $1,762 today in the early Asian trading session.
https://i.imgur.com/hAkVQJJ.png

The short-term outlook for Ethereum has turned mildly bearish.

On the hourly chart:

  • ETHUSD is under bearish pressure after a decline below the $1,800 handle with immediate targets of $1,750 and $1,700.

  • The bearish harami pattern is below the $1,871 handle, signifying the end of a bullish phase.

  • The relative strength index is at 40.11, indicating weak demand for Ether and a continuation of the selling pressure in the market.

  • The CCI is giving a neutral signal, meaning that the Ethereum price is expected to remain in the consolidation phase in the short-term range.

  • ETH price is now trading below the 100-hour simple and 200-hour exponential moving averages.

  • The Ethereum price opened bearish this week.

  • The average true range indicates low market volatility.

VIEW FULL ANALYSIS VISIT - FXOpen Blog...

Disclaimer: This article represents the opinion of the Companies operating under the FXOpen brand only. It is not to be construed as an offer, solicitation, or recommendation with respect to products and services provided by the Companies operating under the FXOpen brand, nor is it to be considered financial advice.

1,007

Re: Technical Analysis by FXOpen

LTCUSD Analysis: Black Marubozu Pattern below $93.46
https://i.imgur.com/pO9DiI6.png

Bulls couldn’t take control of the market, and after touching a high of $93.46 on 23 May, the LTC/USD pair started moving in a bearish trend, touching a low of $82.60 today in the early Asian trading session.
https://i.imgur.com/kK1LlFj.png

The short-term outlook for Litecoin has turned mildly bearish.

On the hourly chart:

  • There is a black Marubozu candle below the $93.46 handle. It signifies the start of a bearish phase in the market.

  • Litecoin price is trading below its 100-hour simple moving average, 200-hour exponential moving average, and its pivot level of $84.49.

  • The relative strength index is at 38.28, indicating weak demand for Litecoin and a shift towards the bearish phase in the markets.

  • Litecoin remains below most of the moving averages, which are giving a bearish signal at current market levels of $84.49.

  • Some of the technical indicators are neutral.

  • The average true range indicates low market volatility.

VIEW FULL ANALYSIS VISIT - FXOpen Blog...

Disclaimer: This article represents the opinion of the Companies operating under the FXOpen brand only. It is not to be construed as an offer, solicitation, or recommendation with respect to products and services provided by the Companies operating under the FXOpen brand, nor is it to be considered financial advice.

1,008

Re: Technical Analysis by FXOpen

Gold and Crude Oil At Risk of More Losses
https://i.postimg.cc/vZBk8qJX/gold.png

Gold price is struggling below the $1,967 support level. Crude oil price is also declining and remains at a risk of more losses below $70.75.

Important Takeaways for Gold and Oil Prices Analysis Today

  • Gold price failed to clear the $1,982 resistance and trimmed gains against the US Dollar.

  • It is now following a short-term declining channel with resistance near $1,948 on the hourly chart of gold at FXOpen.

  • Crude oil prices are also moving lower below $72.80 and $72.00 levels.

  • There was a break below a major bullish trend line with support near $73.50 on the hourly chart of XTI/USD at FXOpen.

Gold Price Technical Analysis
https://i.postimg.cc/Sxv5nLq4/goldx.png

On the hourly chart of Gold at FXOpen, the price struggled to start a fresh increase above the $1,982 resistance. The price started a fresh decline below the $1,967 support.

There was a close below the 50-hour simple moving average and $1,950. The price tested the $1,938 support zone. A low is formed at $1,936.68, and the price is now consolidating losses. It is following a short-term declining channel with resistance near $1,948.

The channel resistance is near the 23.6% Fib retracement level of the downward move from the $1,982 swing high to the $1,938 low. The next major resistance is near the $1,950 level.

If the breakout occurs, the price will target resistance of $1,960 near the 50% Fib retracement level of the downward move from the $1,982 swing high to the $1,938 low and the 50-hour simple moving average. An upside break above $1,960 could send the Gold price toward $1,967. Any more gains may perhaps set the pace for an increase toward the $1,982 level.

Initial support on the downside is near the $1,938 level. The first major support is near the $1,932 level. The next support sits near the $1,920 level. If there is a downside break below $1,920, the price might decline heavily towards $1,900, below which the bulls could aim for a test of $1,880.

VIEW FULL ANALYSIS VISIT - FXOpen Blog...

Disclaimer: This article represents the opinion of the Companies operating under the FXOpen brand only. It is not to be construed as an offer, solicitation, or recommendation with respect to products and services provided by the Companies operating under the FXOpen brand, nor is it to be considered financial advice.

1,009

Re: Technical Analysis by FXOpen

EUR/USD Approaches Important Support
https://i.postimg.cc/k5cmY1bm/eur.png

Yesterday, EUR/USD hit new May’s lows. This week’s latest news contributed to the decline:

→ Germany's GDP in Q1 2023 decreased by 0.3% compared to the previous three months. German media write about the official start of the recession.

→ The US economy in Q1 grew by 1.3% in annual terms.

→ Worrying opinions are spreading about a possible crisis due to the situation in the US housing market. According to JPMorgan analysts, the next shock to the US banking system could be loans for commercial real estate.

→ Traders see the dollar as a reliable asset in the face of the not yet raised US government debt ceiling.

The EUR/USD chart shows that the rate has already fallen by 3.3% from the peaks of May. The rate is approaching the psychological mark of USD 1.07 per euro, which may support the market.

https://i.postimg.cc/k4gd0QQt/eurx.png

VIEW FULL ANALYSIS VISIT - FXOpen Blog...

Disclaimer: This article represents the opinion of the Companies operating under the FXOpen brand only. It is not to be construed as an offer, solicitation, or recommendation with respect to products and services provided by the Companies operating under the FXOpen brand, nor is it to be considered financial advice.

Posts: 1,001 to 1,009 of 1,009

Pages Previous 1 39 40 41

You must login or register to post a reply

Forex Software → Market Analysis → Technical Analysis by FXOpen

Similar topics in this forum