Re: RoboForex - Company news and official support

What is OPEC, and How It Influences Crude Oil Prices

Author : Victor Gryazin

https://blog.roboforex.com/wp-content/uploads/2023/01/OPEC-1536x662.jpg

Dear Clients and Partners,
In this article, we will find out more about OPEC and its activities. We will look at the history of OPEC, and how it was established. We will also try to analyse how the organisation influences world crude oil prices and demand.

What is OPEC?

The term OPEC (Organization of the Petroleum Exporting Countries) refers to a group of thirteen of the world's largest oil-exporting countries. The organisation was founded in 1960 to coordinate the petroleum policies of its member countries and the technical and economic cooperation among them. OPEC is headquartered in Vienna, where the executive body, the OPEC Secretariat, manages the day-to-day operations of the organisation.

OPEC was formed in response to the Seven Sisters alliance, which included major international crude oil corporations such as British Petroleum, Exxon, Mobil, Royal Dutch Shell, Gulf Oil, Texaco, and Chevron. They adversely affected the development of oil-producing countries whose natural resources were actively used.

According to OPEC's charter, the organisation's mission is to coordinate and unify the oil policies of its member countries and stabilise the crude oil market to ensure an efficient and uninterrupted supply of black gold. The basic principles guiding its work are oil for consumers, stable income for producers, and a fair return on capital for those who invest in the crude oil industry.

How OPEC affects the price of crude oil

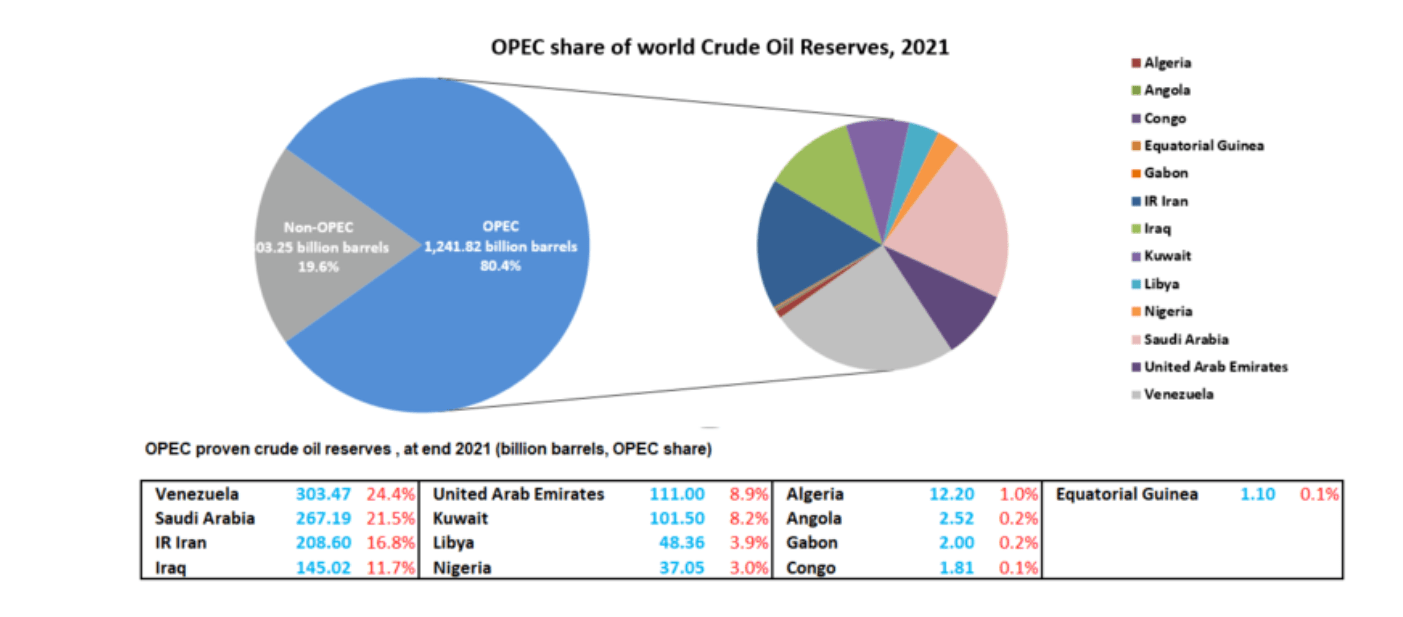
Cartel members produce about 40% of the world's oil, and their exports account for about 60% of global trade in black gold. OPEC estimates that its member countries accounted for more than 80% of the world's proven oil reserves in 2021.

https://blog.roboforex.com/wp-content/uploads/2023/01/OPEC-1.png

Members meet regularly to agree on how much crude oil to collectively sell on world markets. Each member country is assigned its own production quota to which it must adhere.

In case of sharp price fluctuations, OPEC can regulate quotas and, through them, the world's crude oil supply. If the price of the resource falls, OPEC reduces production – this reduces supply, thereby increasing prices. If the cost of crude oil rises excessively, the cartel can increase production to help bring prices down slightly.

For example, during the economic crisis of 2020 caused by the COVID-19 pandemic, oil became very cheap: at one point, futures went from $50 per barrel to even below 0. To stabilise prices, the OPEC+ participants decided to substantially reduce the volume of crude oil produced by cutting quotas. The supply level fell, which made prices rise gradually and rebound to the level of $50 per barrel by the end of the year. Eventually, the price of crude oil reached $100/bbl.

Criticism of OPEC

OPEC criticism dates back to the 1970s when the organisation was perceived as a monopoly. In 1973, member countries from the Middle East banned crude oil sales to the supporters of Israel in the Arab-Israeli conflict, namely the US, Portugal, the Netherlands, and South Africa.  As a result, the price of a barrel of crude oil quadrupled by 1974 and impacted end-users negatively with fuel shortages, and the cost of petrol skyrocketed. The embargo seriously affected the US and other economies.

In response, Western countries in their attempt to reduce their dependence on OPEC stepped up efforts to produce oil offshore in the Gulf of Mexico and the North Sea. Subsequently, global oversupply and lower demand led to a significant drop in the price of black gold.

Still, some countries periodically accuse the cartel of collusion, through which they believe it manipulates the price of crude oil by interfering with market pricing.

The US has drafted a bill, NOPEC (No Oil Producing and Exporting Cartels), which would allow US courts to punish association members and their partners for manipulating production volumes. But the project is still in draft form.

The future of OPEC

The world economy needs stability and predictability when it comes to crude oil prices, production, and export volumes. Therefore, OPEC is likely to retain its position as a price regulator in the short term. The cartel's position looks quite stable in the context of the current energy crisis, and the expected growth in demand for black gold in the coming years.

It is worth noting, however, that in the long term, there are factors that could reduce the impact of the organisation's decisions on the global economy. These could include an increase in the supply of cheap shale oil by non-alliance countries and an increase in the use of renewable energy sources.

Read more at R Blog - RoboForex

Sincerely,
RoboForex team

Re: RoboForex - Company news and official support

How and Why the US Government is Promoting Green Energy

Author : Eugene Savitsky

https://blog.roboforex.com/wp-content/uploads/2023/01/25.01.2023-1536x662.jpg

Dear Clients and Partners,

Today we will talk about the government's economic stimulus packages for clean energy in the US. We will look at the American Recovery and Reinvestment Act signed by Barack Obama in 2009, and the Inflation Reduction Act signed by Joe Biden in 2022. Let's analyse the impact of these laws on the development of green energy in the US.

America’s Recovery and Reinvestment Act

The US economy was harmed by the financial crisis in 2008. By 2009, unemployment had reached 10.2%, which marked the highest level in 25 years. The US government needed to take urgent measures to jumpstart the economy and create new jobs. In response to the 2008 Great Recession, the American Recovery and Reinvestment Act (ARRA) of 2009 was drafted and passed by the US Congress.

This act provided for investments of 90 billion USD in clean energy. At that time, this was the largest investment in the energy sector in the history of the United States. This economic stimulus package laid the foundation for dramatic changes in the energy system, such as massive electrification of land transport and an increase in the amount of energy from renewable sources.

Electrification of the automotive industry

In 2008, Elon Musk's Space Exploration Technologies Corporation (SpaceX) and Tesla Inc. (NASDAQ: TSLA), which were on the verge of bankruptcy, were rescued by NASA contracts. In 2010, the US Department of Energy granted Tesla Inc. a USD 465 million loan to back it up.

It can be assumed that the active development and growth of this car company have triggered accelerated electrification of the global car industry. Many manufacturers have supplemented their model ranges with electric and hybrid cars. According to EV-Volumes, the number of environmentally friendly cars on the road has increased from a few hundred thousand to nearly 27 million units over the past ten years.

https://blog.roboforex.com/wp-content/uploads/2023/01/EV.png

In 2010, Tesla Inc. was the only publicly traded company in the US that focused exclusively on electric vehicles. The return on investment in this corporation by 2020, before the COVID-19 pandemic-induced crisis, exceeded 5500%.

Promoting alternative energy sources

According to the Energy Information Administration (EIA), from 2011 to 2021 inclusive, wind power generation increased by more than 200% to 132,753 MW. Solar power generation increased 88-fold to 93,151 MW. In addition, solar photovoltaic modules, which are capable of producing 1 W of energy, have fallen in price from USD 2.15 to USD 0.27.

At the time of writing, the largest US solar energy companies by market capitalisation were Enphase Energy Inc (NASDAQ: ENPH), First Solar Inc (NASDAQ: FSLR), and Sunrun Inc (NASDAQ: RUN). They were valued at USD 33.4 billion, USD 18.7 billion, and USD 5.9 billion, respectively.

With energy-saving technology becoming widespread, the classification of household appliances according to their energy efficiency level has emerged. Fluorescent lamps, which were previously used mainly in industrial plants, were introduced for home use. Moreover, less efficient and more energy-intensive incandescent lamps were gradually replaced by more economical LED lamps.

Why a law to reduce inflation was passed

The situation in the US today is very different from what it was after the 2008 crisis: unemployment is at a low level and inflation is in positive territory – there was deflation in 2009. However, the government was now facing a new challenge: the likelihood of continued high inflation.

This has been facilitated by reduced investment in conventional energy sources, which has led to a reduction in hydrocarbon production and a substantial rise in the cost of hydrocarbons. With hydrocarbons being used to generate electricity and transport products and components, their cost constitutes a significant part of the cost of many products.

Read more at R Blog - RoboForex

Sincerely,
RoboForex team

128 (edited by Vlad RF 2023-02-02 11:56:12)

Re: RoboForex - Company news and official support

Situational Vs. Systematic Trading: Which One is More Efficient?

Author : Andrey Goilov

https://blog.roboforex.com/wp-content/uploads/2019/10/systematic-sitiational-trading.png

Dear Clients and Partners,

To be successful on financial markets, you need a neat trading system that will give you a clear understanding of how to enter and exit the market either with a profit or a loss. The rules of money management are also worth sticking to as they will psychologically prepare you for a series of losing trades as well as profitable ones.

Trading with a high-quality system is different from trading without one is also better in the sense that you do not need to think about whether the situation on the market is good enough to enter. You simply follow the rules and open or close trades, moving along the price chart.

Unfortunately, no one can tell if the current pattern will be executed or you will have to close it at the Stop Loss. To find out, you just have to trade the chosen method. Of course, you can use certain lifehacks and take measures to increase the probability of the execution of the signal, such as trading on a demo account until you receive two losing positions and only then moving to a real one. There are plenty of ways and methods of trading in the world, and every day millions of traders try to conquer the market.

In this article, we shall have a look at the pros and cons of both systematic and situational trading, discuss their differences, and speak about the practicability of each of them.

Systematic trading

Here, we are talking about a simple indicator-based system that will give the same signals to a dozen of different traders. As a rule, systematic trading does not allow for more than one opinion about the current market situation; the trader just needs to open a position and wait or to wait for a signal to enter the market.

In one of our posts, we spoke about the Ichimoku indicator. At first glance, it seems too complicated, but it boils down to trading the trend and waiting for the entrance signal to form. After that, we open a position and wait for the signals to form. For example, if the price breaks through the Ichimoku Cloud bottom-up, then you can buy.

https://blog.roboforex.com/wp-content/uploads/2019/10/ichimoku-flat-trend.png

If the price breaks through the Cloud top-down, the trend is likely to be descending, so you can sell. You do not need much time to make a decision, following the rules is enough.

Sure, in the times of a flat, you will be getting the breakaways all the time and either be opening and closing too many positions bringing no profit or suffering a series of insignificant losses. However, as soon as a trend begins, the market will be bringing the prices farther and farther from the entrance point. In such a case, you simply need to move the SL and hold the profit until the market reverses and closes your position.

Pros of trading along with the rules

It can often be heard that a good system is no more than 20% of success on the market while the remaining 80% is the ability to follow the rules of money management and stick to your own rules in the hard times, which will happen periodically.

As Victor Niederhoffer used to say: "In investments, as well as in life, the question is not whether you will be knocked down but when it will happen and whether you will manage to get up and keep fighting. The risk of failure is an essential part of human experience which is especially visible on financial markets dominated by speculation, which is the readiness to accept commercial risks".

A huge advantage of such an approach is the easiness of market analysis and decision-making. The lines have crossed — we sell, the lines have crossed back — we close the position and open a new one. If we hand the method to other traders, they will see the same crossings and will sell the same way due to the signal lines crossing. What is more, the trader feels less emotional pressure as he leaves decision-making to the system.

A drawback here is the behavior of the system in a flat. In such a situation, the prices remain in place, while the trader receives signals both to buy and to sell, constantly locking in losing positions.

Situational trading

This approach to trading and market analysis is different from the systematic one. In most cases, situational trading is graphic analysis where traders look for various patterns, such being, for example, Head and Shoulders, the Wolfe Waves, or any other pattern of technical analysis.

The difficult part here is that on D1 the Head and Shoulders pattern may be inversed, while on H1 it may be normal, and this is perplexing. What is more, if other graphic traders look at the very same chart, in the same lines they might see a Triangle or any other pattern, or simply say that it is not worth entering against the trend here.

Read more at R Blog - RoboForex

Sincerely,
RoboForex team

Re: RoboForex - Company news and official support

Larry Connors' Double 7 Trading Strategy

Author : Victor Gryazin

https://blog.roboforex.com/wp-content/uploads/2023/02/24.01.2023-1536x662.jpg

Dear Clients and Partners,

In this material, we will get acquainted with the "Double 7" medium-term trading strategy of the famous trader Larry Connors. We will learn what it is based on, and how it can be used in trading. We will consider its advantages and disadvantages and give an example of trading using this strategy.

How the Double 7 strategy works

The Double Seven is a fairly simple trading system that was introduced in the book “Short-Term Trading Strategies That Work”. It was written by the famous investment consultant and stock trader Larry Connors in co-authorship with the developer of trading systems Cesar Alvarez. The strategy was created for trading in the stock market, and the authors used it to trade major stock indices (S&P 500, Dow Jones) or index ETFs.

The Double 7 is based on the concept that when trading major market indices, an effective strategy is to buy on pullbacks in a major uptrend. A valid uptrend is defined as the price being above the 200-day Moving Average. A pullback is defined as a close below the lowest low of the last seven days, in which case a buy is opened. Once a buy is opened, one must wait for a new seven-day high to close the position.

After reading the trading rules, we can see that the "Double Seven" was developed for daily charts and is only used to open and close long positions in a rising market. That is, it works only in one direction – to buy the asset, shorts (short positions) are not used in this strategy and Stop Loss orders are not set. When tested by Connors and Alvarez, the system showed positive results on stock indices, ETFs, and highly liquid US stocks.

Setting the Moving Average indicator

This strategy uses the Moving Average indicator to determine the current trend. Moving averages are included in most modern trading terminals, plotted directly on the price chart. In the popular trading platforms, MetaTrader 4 and MetaTrader 5, you can install the Moving Average on the chart of the selected instrument through the Main Menu: Insert → Indicators → Trending → Moving Average. In the setup window that appears, select period 200, line colour and thickness, MA method: Simple.

https://blog.roboforex.com/wp-content/uploads/2023/02/DoubleSeven-1-1536x807.png

How to trade the Double 7 strategy

The algorithm for using the strategy in trading:

  1. The price chart should be above the 200-day moving average, indicating an uptrend.

  2. We must wait for the day to close at the low of the last 7 days.

  3. If points 1 and 2 are met, a buy position is opened.

  4. The signal for exiting a position is to close the day at the seven-day high.

Advantages and disadvantages of the Double 7 strategy

Advantages:

  • Works well in a rising market, giving entry points into an uptrend after small corrections. The strategy generates profitable trades, as long as there is a strong uptrend

  • There is no "stop order" in high market volatility, as no Stop Losses are placed

Disadvantages:

  • At the end of an uptrend and a downward reversal, the trading performance declines sharply

  • There is no possibility of trading short positions (shorts) during a downtrend

  • Lack of Stop Losses can lead to prolonged and significant drawdowns of the trader's deposit

Read more at R Blog - RoboForex

Sincerely,
RoboForex team

Re: RoboForex - Company news and official support

How to Beat Greed in Forex?

Author : Victor Gryazin

https://blog.roboforex.com/wp-content/uploads/2020/12/13.jpg

Dear Clients and Partners,

The ability to control your emotions lies at the basis of your expertise as a trader. If a trader falls prey to their emotions, they lose control over their trading. This means breaking the rules of your trading system and, as a rule, ends in losing your money.

In this overview, we will discuss what is greed in Forex and how to beat it.

How does greed appear?

Many people start trading in the hope they will get rich in a short time. This misjudgment is supported by fantastic stories of success spread by the media. You might have heard of a young trader from the US Timothy Sykes who started trading in high school and earned his first million by the age of 21. Sounds amazing, doesn't it?

However, many neglect the fact that Sykes achieved this by long and painful training, making mistakes, losing money, but perfecting his strategy, and coping with his emotions. Experiences traders know that trading provokes the strongest human feelings and passions that you need to bring under control. A bright example is greed that can lead to losses and depression if you let it rule.

Greed is an unstoppable desire to own more and more fortune. Some might say that this is all personal, and there is nothing reproachable in the craving for more. However, greed is usually accompanied by unrealistic expectations and hopes, and a lack of self-control. This becomes a large stumbling rock in the trader's way to success because they start breaking their trading rules, which leads to losses.

Also, greed increases stress and nervousness that nag on the trader throughout their work. This is a direct way to exhaustion that makes it difficult to think rationally about trading in financial markets altogether. Hence, you need to know how to detect greed in the early stages and fight.

Main symptoms of greed

Let us have a look at the main symptoms that signal the advent of greed.

  • Unrealistic expectations

Ambitions are great when they are rational. However, when it comes to money, one's common sense often loses the battle to greed, especially if the first couple of trades was a success. Trading on a demo account, which is where most traders start from, is peculiar in the sense that there is no psychological barrier in it — the money is not real. On a demo account, trading is fun.

That is why many over-ambitious traders rush at switching to a real account. They think that if they made it on a demo, real trading will also go smoothly, so why to waste your time on sheer practice. Their expectations are too high, they imagine how they become millionaires in a week. However, real trading quickly sobers them, but the lack of due preparation and money-management skills leads to losses.

  • Poorly based hopes

A poorly based hope for a profit must in no way be the moving force for a trader. Such hopes, having no real support, lead to increased risks. This feeling is characteristic mostly of beginners, who hope that their trades will for sure bring them a profit if they wait for a little.
A classic example: a trader opened a trade and waits for the price of the asset to reach the desired level. But the market goes another way, and the trader obediently watches their deposit melt. Nonetheless, they do not close the position hoping that the market will soon reverse in their direction. This does happen sometimes but most often, this hope never comes true, and the trader suffers a serious loss.

Ways to control greed

To control your greed and prevent it from harming your trading, you have several proven methods:

  • Stick to your trading rules

The main instrument that helps traders beat greed is a reliable trading system. The latter is a set of certain rules that trading is based on. If a trader sticks to the rules, their greed is under control. They make trades based on clear signals, not the dream to become rich.

  • Track your emotional state

You must always know what and why you are feeling. If you feel that you have lost emotional balance, pause for a while. It will be wise to stay away from the market for a short while after a series of losing or profitable trades. Such series can provoke strong emotions that might harm your trading. Hence, you should stop and calm down before carrying on with your work in your normal balanced state of mind.

  • Control your risks

Risk control is an intrinsic part of trading. Money management is a way to manage your capital by a certain risk control pattern. In other words, this is a way to choose the part or share of your assets that you are ready to risk in each trade. Wise risk control helps you protect your deposit from greed and other emotions.

  • Use pending orders

The use of pending Stop Loss and Take Profit orders decreases the influence of greed on your trading. A Stop Loss limits losses (and protects the profit) when the market turns against the trader. A Take Profit will lock in your profit when the price reaches the specified value. This order helps to close a trade in time near the levels from which the price might correct or reverse.

Closing thought

Greed frequently harms trading in financial markets. Uncontrolled greed makes you violate your trading rules and might lead to serious losses. Hence, you need to detect the symptoms of greed accurately and use proven ways of beating it.

Read more at R Blog - RoboForex

Sincerely,
RoboForex team

Re: RoboForex - Company news and official support

How to Test a Trading Strategy

Author : Victor Gryazin

https://blog.roboforex.com/wp-content/uploads/2023/03/03.03.2023-1536x662.jpg

Dear Clients and Partners,

Today we will explain how to test a trading strategy. We will begin by explaining what a trading strategy is, why it needs to be tested, and how to do this. We will also give you some important recommendations.

What is a trading strategy?

A trading strategy is a trader's main tool that gives them an advantage in the market. In other words, it is a set of trading rules that have been tested in practice. The strategy can be considered successful if the total result of all deals made by using it within a specific period (month, quarter, year) is positive, i.e., profitable.

A trader's failure to have a clear, understandable, and practically proven system when trading can lead to a loss of funds. Making profit from random unsystematic trades is possible, but it will mostly depend on luck rather than experience and knowledge. You can only be successful in the long run if you use a proven trading strategy.

Why test a trading strategy?

Backtesting is the process of assessing how well a trading strategy can perform under past conditions. It is a key component in developing an effective system. There are various possibilities to change strategy parameters, and the adjustments made can have a significant impact on the results. Such testing shows the overall performance of an idea and checks whether some trading parameters will work better than others.

Testing the chosen trading approach on past data allows you to assess its effectiveness without any real monetary investment. The basic logic behind such testing is the assumption that a system that has worked well in the past is likely to also be effective now. Correct backtesting on historical data and obtaining positive results increases the trader's confidence that the idea will work. If the backtest shows negative results, the parameters should be changed or the chosen strategy should be abandoned.

Ways to test a trading strategy

You can test your trading approach on historical data or real trading conditions, either manually or by using special programmes.

Manual backtesting

Manual testing with historical data is a rather time-consuming process. This method is used when automated testing cannot be used for one reason or another.

Manual test scheme:

  1. A chart of the financial instrument is opened. All necessary indicators and tools for trading according to the strategy are installed. The desired timeframe and the period of interest in the quotes history are selected.

  2. The strategy then searches the chart for setups (conditions) for trades.

  3. When a strategy is detected, the trader records all parameters of the potential trade: date, entry point, direction, Stop Loss, Take Profit, trade result, and any other useful information.

  4. After a careful examination of all the potential trades found, their individual results and the total are analysed. A conclusion is made as to whether trading on this system will bring profit or loss.

If the strategy works at a loss, it is abandoned, or adjustments are made to improve its effectiveness. After the changes have been made, the strategy is checked again, and the process is repeated until it achieves an acceptable result. Manual testing of a trading strategy on historical data takes time and discipline. Correctly performed testing creates the conditions for a more accurate understanding of the level of success of the chosen approach and allows you to improve the practical skills of identifying setups for trading.

https://blog.roboforex.com/wp-content/uploads/2023/03/Backtest-1-1536x819.png

Automated backtesting

Special software is used that finds trades that meet the strategy's criteria. It summarises profitable and losing trades to show whether the strategy has been effective over a certain period of time. There are many trading platforms that provide such testers nowadays.

Read more at R Blog - RoboForex

Sincerely,
RoboForex team

Re: RoboForex - Company news and official support

RoboForex: upcoming changes to the trading schedule due to reverting to Daylight Saving Time

https://roboforex.com/uploads/img/news/main/roboforex-header.jpg

Dear Clients and Partners,

We are informing you that there will be some changes to the trading schedule due to reverting from Standard Time to Daylight Saving Time in the USA and European countries.

This schedule is for informational purposes only and may be subject to further change.

MetaTrader 4 / MetaTrader 5 platforms

Schedule for trading CFDs on US indices (US30Cash, US500Cash, USTECHCash) and oil (Brent, WTI)

  • From 13 to 24 March 2023, trading will be opened and closed 1 hour earlier than usual (server time).
    Trading session (server time): 02:00 AM - 10:15 PM.

Schedule for trading CFDs on Metals (XAUUSD, XAGUSD) and CFD on the JP225Cash index

  • From 13 to 24 March 2023, trading will be opened and closed 1 hour earlier than usual (server time).
    Trading session (server time): 12:05 AM - 10:55 PM.

Schedule for trading CFDs on US stocks

  • From 13 to 24 March 2023, trading will be opened and closed 1 hour earlier than usual (server time).

  • Trading session (server time): 03:31 PM - 10:00 PM.

Schedule for trading CFDs on futures (ESM23, YMM23, NQM23)

  • From 13 to 24 March 2023, trading will be opened and closed 1 hour earlier than usual (server time).

  • Trading session (server time): 12:00 AM - 11:00 PM.

Please note that, on 17 and 24 March 2023, trading all instruments in all platforms will be closed at 11:00 PM server time. In addition, from 13 to 24 March 2023, the bank rollover time will be from 10:00 PM to 12:30 AM server time. Consequently, this might lead to short-term interruptions in quoting, and the significant widening of spreads.

R StocksTrader platform

Schedule for trading US Stocks, US ETFs, CFDs on US Stocks and ETFs

  • From 13 to 24 March 2023, trading will be opened and closed 1 hour earlier than usual (server time).
    Trading session (server time): 03:30 PM - 10:00 PM.

Schedule for trading CFDs on Crude Oil (BRENT.oil, WTI.oil)

  • From 13 to 24 March 2023, trading will be opened and closed 1 hour earlier than usual (server time).
    Trading session (server time): 02:00 AM - 10:15 PM.

Schedule for trading CFDs on Metals (XAUUSD, XAGUSD)

  • From 13 to 24 March 2023, trading will be opened and closed 1 hour earlier than usual (server time).
    Trading session (server time): 12:05 AM - 10:55 PM.

Schedule for trading all currency pairs

  • From 13 to 24 March 2023, trading all currency pairs will be stopped for the 11:00 PM - 11:15 PM interval (server time).

Schedule for trading CFDs on futures (ESM23, YMM23, NQM23)

  • From 13 to 24 March 2023, trading will be opened and closed 1 hour earlier than usual (server time).

  • Trading session (server time): 12:00 AM - 11:00 PM.

Please note that, on 17 and 24 March 2023, trading all instruments including Cryptocurrencies on all platforms will be closed at 11:00 PM server time.

cTrader platform

Schedule for trading all currency pairs

  • From 13 to 24 March 2023, trading all currency pairs will be stopped for the 10:55 PM - 11:05 PM interval (server time).

Schedule for trading CFDs on Metals (XAUUSD, XAGUSD)

  • From 13 to 24 March 2023, trading will be opened and closed 1 hour earlier than usual (server time).

  • Trading session (server time): 12:05 AM - 10:55 PM.

Please note that, on 17 and 24 March 2023, trading on all instruments on all platforms will be closed at 11:00 PM server time. In addition, from 13 to 24 March 2023, the bank rollover time will be from 10:00 PM to 12:30 AM server time. Consequently, this might lead to short-term interruptions in quoting, and the significant widening of spreads.

Please take note of the above trading schedule changes when planning your trading activity.

Sincerely,
RoboForex team

Re: RoboForex - Company news and official support

How To trade the GBP/JPY Strategy Using the Bollinger Bands

Author : Andrey Goilov

https://blog.roboforex.com/wp-content/uploads/2023/03/10.03.2023-1472x828.jpg

Dear Clients and Partners,

Today we will look at a short-term trading strategy based on the Bollinger Bands indicator with different timeframes. It is designed to work with the currency pair GBP/JPY on the M1 chart.

GBP/JPY is a highly volatile instrument, and the technical indicator will indicate instants when the price diverges significantly from its average fluctuation and there is a high probability of a move in the opposite direction.

How to trade GBP/JPY with the Bollinger Bands strategy

https://blog.roboforex.com/wp-content/uploads/2023/03/Pic-1.png

We will show you how to use Bollinger Bands signals with three different deviation values. We will look at the position opening and discuss the Stop Loss and Take Profit rules according to the strategy.

Bollinger Bands in brief

Bollinger Bands is designed as a trend indicator, and it can show not only the direction of the current trend but also estimate volatility. It has three lines: a simple moving average with a period of 20 is positioned in the middle, while two other lines are positioned above and below, estimating maximum and minimum values. The extreme lines act as a floating support and resistance levels.

According to the author of Bollinger Bands, prices spend 95% of the time in the area between the bands of the indicator. Therefore, any price move out of this corridor can be seen as a reversal possibility and an imminent return of prices to average values.

https://blog.roboforex.com/wp-content/uploads/2023/03/Pic-2.png

The behaviour of Bollinger Bands during strong market trends is also interesting. As a rule, in an uptrend, an investor wants to buy at the lowest price. In this case, one should expect the price to test the lower boundary of the indicator. In a downtrend, the investor wants to sell at the maximum price. In this case, the price is expected to test the upper boundary of the indicator.

How to set up Bollinger Bands

  • Add the Bollinger Bands indicator to the chart. To set the drawing period and colour of lines, double left-click on the indicator in the chart or right-click once and select "Properties" in the menu that appears. Then change the colour of the lines and the deviation value in the opened settings window.

  • Bollinger Bands with deviation 2 - select the red colour of the lines. Extreme lines of the indicator characterise the nearest support and resistance levels. According to the author of the indicator, the price very rarely moves beyond these lines

  • Bollinger Bands with deviation 3 - choose the blue colour of the lines. According to the author of the indicator, price moves beyond these lines are even rarer

  • Bollinger Bands with deviation 4 - choose the green colour of the lines. According to the author of the indicator, the price will reach these lines as rarely as possible, only at moments of peak volatility in the market

Read more at R Blog - RoboForex

Sincerely,
RoboForex team

Re: RoboForex - Company news and official support

Reversal Patterns: How to Detect a Change in Trend Direction?

Author : Maks Artemov

https://blog.roboforex.com/wp-content/uploads/2020/06/patterns.jpg

Dear Clients and Partners,

Imagine a distinct uptrend that has long been in the market. How do we know when it is over? Or, if a descending dynamics last long, how do we know where it reverses? These are the questions that many traders are perplexed by.

There is no unique answer to this question. The trend may reverse at any time, so the trader's task is to detect the time and place. There are lots of theories, practices, indicators, and other ways of market analysis meant for this.

Today, I will speak about a classical method of detecting a trend reversal. Watching the charts, market players have come to certain conclusions about the laws of price movements. At specific moments, the impulse comes to an end, and the trend changes its direction. Let us have a look at a group of reversal patterns, which are likely to precede a trend reversal.

What patterns do we look for?

Before speaking about reversal patterns, a small remark: candlestick patterns may have different names in different strategies and translations; moreover, they may differ slightly in appearance, however, their essence remains the same.

The main candlestick patterns at the top of the trend would be:

  • Shooting Star

  • Hanging Man

  • Doji

  • Gravestone Doji

  • Harami

  • Engulfing

Reversal patterns at the top of the trend

One condition, common for all reversal patterns, is the presence of a strong support or resistance level and a long-term trend.

Shooting Star

It looks like a candlestick with a small body and a very long upper shadow. It normally forms after the abrupt growth of the quotations. The lower shadow, in this case, will be short. Ideally, the body of the candlestick and the impulse have opposite colors (after a row of growing candlesticks, the Shooting Star is a descending one).

https://blog.roboforex.com/wp-content/uploads/2020/06/1-shooting-star-1200x540.png

Hanging Man
.
In essence, it is an inverted Shooting Star. The upper shadow is minimal or lacking, the body looks small, the lower shadow looks rather long. The Hanging Man is similar to the Hammer.

Doji

These candlesticks may form at any place of the chart and still have the name Doji. Other candlesticks are different, and we will discuss them later on.

A Doji looks like a cross or a "+". This means it has tiny shadows, and its body looks like a line because the opening and closing prices are on one line. Some Dojis have two long shadows and are called Legged Dojis; however, the signal they give is the same.

Reversal patterns at the bottom of the trend

Now - to the reversal patterns at the bottom of the trend. I should make it clear that the candlestick patterns themselves may look absolutely identical to those that form at the peak of the trend; however, they have different names. The work off is also the same: a trend reversal.

Hammer

It looks like the Hanging Man: a small body, a small or lacking upper shadow, and a long lower shadow. The only difference is that the pattern forms at the bottom of the trend.

https://blog.roboforex.com/wp-content/uploads/2020/06/7-hammer-1200x540.png

Inverted Hammer

It is similar to the Shooting Star: a long upper shadow, a small body, and an almost lacking lower shadow. Like the Hammer, it forms at the bottom of the trend.

Engulfing

It consists of two candlesticks. The first descending bar has a short body, the second one is visually larger, and its body covers up the projection of the first pattern.

Read more at R Blog - RoboForex

Sincerely,
RoboForex team

Re: RoboForex - Company news and official support

How To Trade the "Moving Averages Based on Fibonacci Numbers" strategy

Author : Victor Gryazin

https://blog.roboforex.com/wp-content/uploads/2023/03/17.03.2023-1536x864.jpg

Dear Clients and Partners,

In this article, we will look at a medium-term indicator trading strategy using multiple moving averages based on Fibonacci numbers. We will find out which indicators to set and talk about the rules for making trades.

How the strategy works

Fibonacci numbers originated with the famous Italian mathematician Leonardo of Pisa, who was better known as Fibonacci. He investigated an infinite mathematical sequence that was later named after him. In it, each successive number is equal to the sum of the previous two numbers: 0, 1, 1, 2, 3, 5, 8, 13, 21, 34, 55, 89, 144, and so on.

Dividing the previous number in the sequence by the next number gives 0.618. Dividing the previous number in the sequence by the next number through one produces 0.382. The golden ratio is based on this relationship. With the advent of exchange trading, the Fibonacci sequence began to be used in trading. Various tools based on Fibonacci numbers can be found in almost any trading platform.

This strategy uses the intersection of four exponential moving averages (EMAs) with periods corresponding to the Fibonacci numbers (5, 8, 13, 21) to find trading signals. Moving averages have long established themselves as a simple and effective tool for trend analysis.

When all four moving averages are moving horizontally and intertwined, this is a sign that the market is in a sideways corridor and there is no clear trend. When the price is rising and indicator lines begin to diverge and move upwards, this signals the beginning of an uptrend. When the price decreases and the indicators diverge moving downwards, it indicates the beginning of a downtrend.

https://blog.roboforex.com/wp-content/uploads/2023/03/MAfibo-1-1536x854.png

How to install the Moving Average indicator

The Moving Average indicator is included in most modern trading terminals, displayed directly on the price chart. In the popular MetaTrader 4 and MetaTrader 5 trading platforms, you can install the Moving Average on the chart of the selected instrument through the Main Menu: Insert → Indicators → Trends → Moving Average.

In the window that appears, select period 5, colour and thickness of the line, and method MA: Exponential. Repeat these steps to set up three more moving averages with periods of 8, 13, and 21, selecting different colours for the indicator lines. This will result in four differently coloured moving averages on the price chart, which will be used to search for trading signals according to the strategy.

How to use the strategy in trading

This strategy is quite versatile and can be used on different timeframes and financial instruments. To trade, you have to wait for the price to move up or down out of the sideways range. In a sideways range, all four moving averages are intertwined and move horizontally – there are no trading signals.

A buy signal for the strategy

  • The price begins to rise, crossing all four moving averages from bottom to top, renewing the nearest local high

  • The moving average lines cross and begin moving upwards, gradually diverging from each other

  • A buy position is opened, and the Stop Loss is set at the nearest local low, which is below the moving averages

  • Take Profit is taken when the moving averages are crossed in the opposite direction, or when the price reverses and closes below all four moving averages

Advantages and disadvantages of the strategy

Advantages:

  • The strategy works well in trends, allowing you to profit from strong and sustained movements

  • The potential profit can be several times greater than the potential loss

Disadvantages:

  • As this strategy gives unprofitable signals during a flat period, it is better not to use it in a flat period

  • Moving signals can be slightly delayed, so a significant amount of profit can be lost on sharp market reversals

Read more at R Blog - RoboForex

Sincerely,
RoboForex team

Re: RoboForex - Company news and official support

RoboForex adds the Performance Fee scheme for CopyFX to the R StocksTrader app

https://roboforex.com/uploads/news/2023/copyfx-rstockstrader-perfomance-fee/news__rstockstrader-perfomance-fee.jpg

Dear Clients and Partners,

Here we come with a long-awaited CopyFX update on R StocksTrader: RoboForex added a new possibility for the CopyFX Traders to earn commission from their subscribers - the Performance fee.

The Performance Fee

is a commission scheme in CopyFX which allows Traders to get the share of the total amount of profit made by their subscribed Investors, so the more your subscribers earn from their copied deals - the more commission you get.

This scheme mostly suits experienced and confident Traders who demonstrate a stable performance in the medium and long run.

https://s1.hostingkartinok.com/uploads/images/2023/03/c3346a663c941529a8b95853753db6d2.png

More about Performance Fee

Why do Traders choose CopyFX in R StocksTrader?

Minimal investments
Minimal deposit of 100 USD.

High order execution speed at the same price
Instant copying of transactions with the same execution price for the Trader and the Investor guaranteed.

Comfortable app
Trade in R StocksTrader any time from any place and make a profit on commissions.

1,500+ instruments for copying
Take advantage of this unique opportunity and offer Investors more than 1,500 instruments to copy.

Copy trading is proven popular among our clients and partners. We are, therefore, constantly developing our products, enhancing them, and introducing new functions to both the desktop and mobile versions of the platform. Stay tuned for the next update!


Become a CopyFX trader in R StocksTrader now
and embrace all the benefits!

https://s1.hostingkartinok.com/uploads/images/2023/03/f6202d1e4a8c26f68e2a56ebbee8c1d2.png

https://s1.hostingkartinok.com/uploads/images/2023/03/24a79595f93dccf0264607a6fdd95059.png

Learn more about copy trading

Sincerely,
RoboForex team

Re: RoboForex - Company news and official support

How To Trade the On Neck Candlestick Pattern

Author : Victor Gryazin

https://blog.roboforex.com/wp-content/uploads/2023/03/22.03.2023-1536x864.jpg

Dear Clients and Partners,

In this review, we will get acquainted with the trend continuation candlestick pattern called "On Neck”. We will look at the features of its formation and the trading rules for its application. We will learn its main advantages and disadvantages, and also list a few important recommendations for its use.

How the On Neck pattern is formed

The "On Neck" candlestick pattern is a pattern that indicates a further continuation of the current trend. It is rarely seen on price charts. It consists of two candlesticks: the first has a large body pointing in the direction of the current trend, and the second has a small body. They are always of different colours: if the first candlestick is white, the second is black, and vice versa.

The feature of this model is that the second candlestick opens with a gap in the direction of the trend and then closes the gap with its body. The closing prices of the two candlesticks should be about the same. The first candlestick symbolises the "body", the second one is the "head", and the line connecting them and passing through the closing prices is the "neck", hence the name of the pattern.

The appearance of a small black candlestick after a large white candlestick in an uptrend indicates that the "bulls" have met temporary resistance, and when overcoming it, will be able to continue to move upwards. The appearance of a small white candlestick after a large black one in a downtrend indicates temporary support, through which the "bears" are likely to continue the downward movement.

Bullish "On neck" pattern

This is formed during an uptrend when there is an active upward price movement. The first candlestick of the pattern (large white) appears first, and then the second candlestick opens with a gap upwards. The "bears", trying to seize the initiative, return the quotations to the closing price of the first candlestick. The second candlestick (small black) absorbs the gap with its body, with the closing prices of the two candlesticks approximately coinciding.

A bullish continuation of the "On neck" pattern is formed on the chart. We must now wait for confirmation that the "bulls" are still strong enough to overcome the temporary resistance of the "bears". A further rise in quotations above the high of the pattern’s second candlestick will confirm this. This upward movement will mean that the buyers are still very strong, and the uptrend is likely to continue.

https://blog.roboforex.com/wp-content/uploads/2023/03/OnNeckLine-1.png

How to buy using the bullish on neck pattern

  • During an uptrend, a bullish "On Neck" pattern is formed on the price chart

  • It is recommended to open a buy position when the price rises above the maximum of the second candlestick in the pattern (small black candlestick). Stop Loss is set at the low of the first candlestick (large white)

  • To set Take Profit, you can focus on significant support and resistance levels

How to sell using the bearish on neck pattern

  • During a downtrend, a bearish "On Neck" pattern is formed on the price chart

  • It is recommended to open a sell position after the price decreases below the low of the second candlestick in the pattern (small white). Stop Loss is set at the high of the first candlestick (big black candlestick)

  • To set Take Profit, you can focus on significant support and resistance levels

Recommendations for the use of the pattern in trading

  • The pattern should be formed in a pronounced upward or downward trend – it is not traded in a sideways trend

  • Wait for a confirmation – an update of the pattern’s high/low – before opening a trade

  • To increase efficiency, the model can be used in conjunction with technical analysis tools

  • It is best to use higher time frames, from H4 and above

  • It is necessary to follow the rules of risk management and place protective stop-loss orders

Read more at R Blog - RoboForex

Sincerely,
RoboForex team

Re: RoboForex - Company news and official support

False Breakouts on Financial Markets: How to Detect and Use?

Author : Andrey Goilov

https://blog.roboforex.com/wp-content/uploads/2019/11/false-breakdown.png

Dear Clients and Partners,

Hi everyone, today I'm going to talk about false breakouts. In certain cases, it might be unclear to the trader whether there has happened a breakout of the resistance level and, hence, the bullish trend will continue. Such a breakout might be false so that the price will reverse quite soon and go in the opposite direction. In certain cases, such formations may provoke a full-scale reversal of the trend.

As a rule, such things happen at the moment of testing the support/resistance levels. This situation is similar to a reversal. However, it might be a test of a normal trendline, as well as the completion of such patterns of tech analysis as the Triangle or Head and Shoulders, when the price escapes the pattern and the falseness of such a breakout becomes questionable.

This type of breakouts pertains to chart analysis. If we are evaluating the chart without indicators, our evaluation will always be subjective to some extent. It is should be kept in mind that this is an integral part of chart analysis.

What is a false breakout?

In most cases, a false breakout is the "tail" of a Japanese candlestick, which means that the price tried to break the support level away but the sellers were not strong enough to secure themselves under this level. Then the price bounces and moves upwards. This might signify the strength of the buyers and forecast further growth.

Types of false breakouts

Larry Williams was one of the first experts to describe false breakouts. He singled out such a type as Specialists Trap. If the market is bullish, the pattern is formed at the breakout of the resistance level closing much higher than the resistance area. The minimum of the candlestick preceding the one with the breakout acts as a sort of a critical level here.

https://blog.roboforex.com/wp-content/uploads/2019/11/1-usdcad-false-breakdown.png

In the case of falling and breaking this level away, we should expect a market reversal and overall falling. Larry Williams thinks that here we can see the false breakout form when traders enter the market emotionally.

How to detect a false breakout?

Tech analysts give different hints on false breakouts of levels or trendlines. For example, a true breakout requires closing above the resistance level. If the close prices return under the level the breakout may be false, so no growth us to be expected here.

Also, there is a rule of 3% applicable to important levels and lines. It says that the prices must rise above the level by more than 3%.

Imagine we are watching good growth of the gold prices. The important support area is at the level of 1455. If this level is broken away we might speak about a potential reversal to a downtrend.

If we apply the rule of 3% here the price must fall below 1411 for the breakout to be true. A decline to 1450 and a return indicates a false breakout, after which the growth is likely to continue.

https://blog.roboforex.com/wp-content/uploads/2019/11/6-xauusd-breakdown.png

However, this rule is just an instrument that helps distinguish between true and false breakouts. Other traders add time filters or follow-up tests of the broken levels to avoid false breakouts.

How to use false breakouts?

Larry Williams points at the fact that it is impossible to know beforehand whether the level will be broken out or not. What is more, he insists on using our own methods of analysis to use false breakouts effectively. As we may see, when the market is growing and a reversal Double Top may form, it is likely that the breakout of the resistance level will be followed by a further decline of the price. So, if it looks like the pattern will form, no growth should be expected.

Conversely, if the market is falling and its structure reminds of a Double Bottom, one should not hurry to sell after a breakout. If the prices have managed to return inside the pattern soon after the breakout, a market reversal is likely to happen, so that the pattern will be executed.

Very often traders use the MACD indicator that shows divergences on the chart well. If at the moment of a breakout of an important level there forms a convergence or a divergence on the chart, the breakout is likely to be false and the market should be entered in the opposite direction.

Read more at R Blog - RoboForex

Sincerely,
RoboForex team

Re: RoboForex - Company news and official support

How To Trade the “S&P 500 Trend Following Strategy”

Author : Victor Gryazin

https://blog.roboforex.com/wp-content/uploads/2023/03/31.03.2023-1536x864.jpg

Dear Clients and Partners,

In this article, we will look at the long-term indicator trading "S&P 500 Trend Following" strategy. We will find out how it works, how it is used in trading, and what indicator signals it is based on. We will also list its advantages and disadvantages.

How the S&P 500 Trend Following strategy works

This long-term strategy implies trading the S&P 500 (US 500) stock index in the direction of the current market trend. Note that this index is probably the best-known and most popular stock index in the world. It includes the stocks of the 500 largest companies traded on the US stock market and serves as a barometer of the state of the US stock market.

Renowned investors and asset managers Meb Faber and Paul Tudor Jones are the creators and popularisers of the S&P 500 Trend Following strategy. They presented a rather simple and at the same time effective trend-following trading system for the S&P 500 Index, which is based on the signals of the 200-day moving average.

The S&P 500 often shows a steady uptrend during periods of a rising stock market. The indicator should help to identify the beginning of the next long-term trend and give investors a signal to buy to profit from the index growth.

To describe the strategy simply: when the S&P 500 is above the 200-day moving average, the trend is upward, and it is a good time to buy the index; when it is below the indicator line, the trend changes, moving downward, and all positions must be closed.

How to install the Moving Average indicator

The Moving Average (MA) has long established itself as a simple and effective tool for trend analysis. The indicator is included in most modern trading terminals where it is displayed directly on the price chart.

To set the Moving Average in the popular MetaTrader 4 and MetaTrader 5 trading platforms, follow these steps:

  1. Open the terminal and log in to your account.

  2. Select the S&P 500 from the list of available financial instruments and add it to the chart.

  3. From the main menu, click on Insert, then on Indicators, then on Trend, and select Moving Average.

  4. Select the period 200, the line colour and width, and the MA: Simple, and click OK to apply the settings and close the indicator settings window.

As a result, a 200-day moving average will appear on the price chart, which will be used to identify the current trend and search for trading signals according to the strategy.

https://blog.roboforex.com/wp-content/uploads/2023/03/trendSP500-2-1-1536x824.png

How to use the strategy in trading

The S&P 500 trend-following strategy trades in one direction only – to buy the asset. Its trading principle is simple:

  • When the closing price of the index crosses the 200-day Moving Average from bottom to top, this indicates the beginning of an upward trend and gives a signal to buy

  • When the closing price of the index crosses the 200-day moving average from top to bottom, this signals the end of the uptrend and the need to close buy positions

Advantages and disadvantages of the strategy

Advantages:

  • The strategy works well during a sustained uptrend, allowing you to profit on strong and prolonged movements of the S&P 500 index

  • The potential profit can be many times greater than the potential loss

Read more at R Blog - RoboForex

Sincerely,
RoboForex team

Re: RoboForex - Company news and official support

RoboForex: upcoming changes to the trading schedule in view of the Easter holidays

https://roboforex.com/uploads/img/news/main/roboforex-header.jpg

Dear Clients and Partners,

We are informing you that due to the Easter holidays in Europe and the US, there will be some changes to the trading schedule on Good Friday and Easter Monday.

This schedule is for informational purposes only and may be subject to further change.

MetaTrader 4 / MetaTrader 5 platforms

Schedule for trading on CFDs on the German index DE40Cash

  • 7 April 2023 – no trading

  • 10 April 2023 – no trading

  • 11 April 2023 – trading as usual

Schedule for trading on CFDs on the US indices (US30Cash, US500Cash, USTECHCash) and the Japanese index JP225Cash

  • 7 April 2023 – trading stops at 4:00 PM server time

  • 10 April 2023 – trading as usual

Schedule for trading on Metals (XAUUSD, XAGUSD) and CFDs on oil (Brent, WTI)

  • 7 April 2023 – no trading

  • 10 April 2023 – trading as usual

Schedule for trading on CFDs on US stocks

  • 7 April 2023 – no trading

  • 10 April 2023 – trading as usual

Schedule for trading on CFDs on US futures

  • 7 April 2023 – trading stops at 4:15 PM server time

  • 10 April 2023 – trading as usual

R StocksTrader platform

Schedule for trading on US Stocks, US ETFs, CFDs on US Stocks and ETFs

  • 7 April 2023 – no trading

  • 10 April 2023 – trading as usual

Schedule for trading on CFDs on US indices (US30, US500, NAS100)

  • 7 April 2023 – trading stops at 4:00 PM server time

  • 10 April 2023 – trading as usua

Schedule for trading on CFDs on the EU indices (GER40, UK100, FRA40, SPA35), the Australian index AUS200, and the Japanese index J225

  • 7 April 2023 – no trading

  • 10 April 2023 – no trading

  • 11 April 2023 – trading as usual

Schedule for trading on CFDs on EU Stocks

  • 7 April 2023 – no trading

  • 10 April 2023 – no trading

  • 11 April 2023 – trading as usual

Schedule for trading on CFDs on UK Stocks

  • 7 April 2023 – no trading

  • 10 April 2023 – no trading

  • 11 April 2023 – trading as usual

Schedule for trading on CFDs on US futures

  • 7 April 2023 – trading stops at 4:15 PM server time

  • 10 April 2023 – trading as usual

Schedule for trading on Metals (XAUUSD, XAGUSD) and CFDs on Crude Oil (BRENT.oil, WTI.oil)

  • 7 April 2023 – no trading

  • 10 April 2023 – trading as usual

cTrader platform

Schedule for trading on Metals (XAUUSD, XAGUSD)

  • 7 April 2023 – no trading

  • 10 April 2023 – trading as usual

Please take note of the above trading schedule changes when planning your trading activity.

* – This schedule is for informational purposes only and may be subject to further change.

Sincerely,
RoboForex team

Re: RoboForex - Company news and official support

RoboForex has increased partner commission for Gold, Silver, Oil, and US indices

https://roboforex.com/uploads/news/2023/affiliate-programme-update-012023/bg-img.jpg


Dear Clients and Partners,

The RoboForex Partner Programme has become even better! We increased the partner commission for trading Gold, Silver, Oil, and US indices. As a RoboForex Partner you can now earn at least two times more when your clients trade these popular instruments.

https://s1.hostingkartinok.com/uploads/images/2023/04/4259519ed14d014f6a93be97491e220e.png

Example of partner commission rate for Pro accounts:

https://s1.hostingkartinok.com/uploads/images/2023/04/d2b8946e0dcd0279f072eb47a9be3209.png

Calculate your increased commission

Join one of the best markets' Partner Programme

  • High commission
    Earn up to 70% of the broker’s revenue, and additionally up to 20% within the framework of the loyalty programme.

  • Special Affiliate accounts
    Get maximum payouts with the help of client accounts with increased spreads and commissions for a transaction.

  • Multilevel programmes
    Create your own partner network in one of two schemes: 2 levels "VIP" programme, or 5 levels "Expert".

  • Copy-trading
    Attract clients to the CopyFX copy-trading system and receive commission like a Partner. And if you're an experienced trader, you can get two types of commission: one from investors copying your strategies, and the Partner commission.

How to become a Partner

  1. Open a Partner account

  2. Use promotional materials to attract clients

  3. Receive your commission for your referrals' transactions

https://s1.hostingkartinok.com/uploads/images/2023/04/8e5602775cc14a84d2df72186390d3d6.png

Sincerely,
RoboForex team

Re: RoboForex - Company news and official support

How to Trade the Three Moving Averages + MACD Strategy

Autho : Victor Gryazin

https://blog.roboforex.com/wp-content/uploads/2023/04/07.04.2023-1536x864.jpg


Dear Clients and Partners,

In this article, we will look at a medium-term indicator trading strategy based on using three Moving Averages and MACD. We will learn how to set these indicators on the chart and apply them in trading.

How the Three Moving Averages + MACD strategy works

The "Three Moving Averages + MACD" strategy, as the name implies, is a trading system based on the combined use of trend indicators’ Moving Average (MA) and MACD (Moving Average Convergence/Divergence) oscillator signals. These are popular and in-demand tools, which are often used in various trading systems. To trade on the strategy, three exponential Moving Averages (EMA) with periods of 5, 15, and 50, and the MACD with parameters 12, 26, and 9 are applied to the chart.

The Moving Average has long been proven to be a simple and effective tool for trend following. In this strategy, the slow EMA (50) is used to identify the direction of the current trend and acts as a guide to limit risk, while the faster EMA (5) and EMA (15) are used to identify points to enter the market.

The MACD indicator belongs to the oscillator group. It helps to determine the trend direction, strength and duration, price range, and reversal levels and to receive trading signals. The MACD is used in this strategy to confirm the priority trading direction.

How this strategy works:

  • When the EMA (5) crosses the EMA (15) from bottom to top, there is a buy signal. The price chart should be above the EMA (50), and the MACD histogram should be in the positive zone (above 0)

  • When the EMA (5) crosses the EMA (15) from top to bottom, there is a signal to sell. The price chart should be below the EMA (50), and the MACD histogram should be in the negative zone (below 0)

https://blog.roboforex.com/wp-content/uploads/2023/04/MAandMACD-1-1536x847.png

How to use the strategy in trading

The Three Moving Averages + MACD strategy is primarily focused on the EUR/USD and GBP/USD currency pairs. Recommended chart timeframes - H4, D1. Recommended Take Profit (5 digits) for EUR/USD: H4 time frame - 1000 pips, D1 time frame - 2000 pips. Recommended Take Profit values (5-digit quotes) for GBP/USD: H4 time frame - 1250 pips, D1 time frame - 2500 pips. Stop Loss is set immediately after the EMA (50).

Three Moving Averages + MACD Buy Signal

  • Prices begin to rise, EMA (5) crosses EMA (15) from bottom to top

  • The price chart is above the EMA (50)

  • The MACD histogram is in the positive zone (above 0)

  • A buy position is opened, and the Take Profit value is set according to the above recommendations

  • Stop Loss is set just below the EMA (50)

Three Moving Averages + MACD buying example

  • On 17 March 2023, on the H4 chart of the GBP/USD currency pair, the red EMA (5) crossed the blue EMA (15) from bottom to top

  • The price chart was above the green EMA (50) at this point

  • The MACD histogram was in the positive zone (above 0)

  • The buy position was opened at 1.21070, and Take Profit was set 1250 pips higher at 1.22320

  • Stop Loss was set just below the EMA (50), at 1.20500

https://blog.roboforex.com/wp-content/uploads/2023/04/MAandMACD-4-1536x848.png

Three Moving Averages + MACD Sell Signal

  • Quotes begin to decline, EMA (5) crosses EMA (15) from top to bottom

  • The price chart is below the EMA (50)

  • The MACD histogram is in the negative zone (below 0)

  • A sell position is opened, and the Take Profit value is set according to the above recommendations

  • Stop Loss is set just above the EMA (50)

Read more at R Blog - RoboForex

Sincerely,
RoboForex team

Re: RoboForex - Company news and official support

Situational Vs. Systematic Trading: Which One is More Efficient?

Author : Andrey Goilov

https://blog.roboforex.com/wp-content/uploads/2019/10/systematic-sitiational-trading.png


Dear Clients and Partners,

To be successful on financial markets, you need a neat trading system that will give you a clear understanding of how to enter and exit the market either with a profit or a loss. The rules of money management are also worth sticking to as they will psychologically prepare you for a series of losing trades as well as profitable ones.

Trading with a high-quality system is different from trading without one is also better in the sense that you do not need to think about whether the situation on the market is good enough to enter. You simply follow the rules and open or close trades, moving along the price chart.

Unfortunately, no one can tell if the current pattern will be executed or you will have to close it at the Stop Loss. To find out, you just have to trade the chosen method. Of course, you can use certain lifehacks and take measures to increase the probability of the execution of the signal, such as trading on a demo account until you receive two losing positions and only then moving to a real one. There are plenty of ways and methods of trading in the world, and every day millions of traders try to conquer the market.

In this article, we shall have a look at the pros and cons of both systematic and situational trading, discuss their differences, and speak about the practicability of each of them.

Systematic trading

Here, we are talking about a simple indicator-based system that will give the same signals to a dozen of different traders. As a rule, systematic trading does not allow for more than one opinion about the current market situation; the trader just needs to open a position and wait or to wait for a signal to enter the market.

In one of our posts, we spoke about the Ichimoku indicator. At first glance, it seems too complicated, but it boils down to trading the trend and waiting for the entrance signal to form. After that, we open a position and wait for the signals to form. For example, if the price breaks through the Ichimoku Cloud bottom-up, then you can buy.

https://blog.roboforex.com/wp-content/uploads/2019/10/ichimoku-flat-trend.png

If the price breaks through the Cloud top-down, the trend is likely to be descending, so you can sell. You do not need much time to make a decision, following the rules is enough.

Sure, in the times of a flat, you will be getting the breakaways all the time and either be opening and closing too many positions bringing no profit or suffering a series of insignificant losses. However, as soon as a trend begins, the market will be bringing the prices farther and farther from the entrance point. In such a case, you simply need to move the SL and hold the profit until the market reverses and closes your position.

Pros of trading along with the rules

It can often be heard that a good system is no more than 20% of success on the market while the remaining 80% is the ability to follow the rules of money management and stick to your own rules in the hard times, which will happen periodically.

As Victor Niederhoffer used to say: "In investments, as well as in life, the question is not whether you will be knocked down but when it will happen and whether you will manage to get up and keep fighting. The risk of failure is an essential part of human experience which is especially visible on financial markets dominated by speculation, which is the readiness to accept commercial risks".

A huge advantage of such an approach is the easiness of market analysis and decision-making. The lines have crossed — we sell, the lines have crossed back — we close the position and open a new one. If we hand the method to other traders, they will see the same crossings and will sell the same way due to the signal lines crossing. What is more, the trader feels less emotional pressure as he leaves decision-making to the system.

Pros and cons of situational trading

It must be admitted that an experienced trader can show a better result in trading graphic patterns than someone who has just seen a pattern and is trying to use it. In other words, experience is critical here. If you practice situational trading, you will have to think a lot and sometimes make hard decisions, which is lacking in the systematic approach to trading on financial markets.

So, analyzing charts regularly on different timeframes and sticking to your own rules of trading, sometimes postponing open positions due to low volatility, may be very hard in the long run. What should the trader choose?

How to choose an approach for a trader?

If the trader is new to the market, systematic trading by strict rules might be the best option. It will spare them from excessive market entries without good signals as well as decrease emotional pressure during a series of losing positions. In the process of trading, the beginner will be moving along the stages of a trader's development to the top where they can use their experience for situational trading, getting rid of some strict signals of the system that has shown the worst results.

We should not forget that a good system is just 20% of the overall result: you have to master risk control and feel confident suffering losses and locking in profit. A sports car will not make a racer out of an ordinary driver; same way, for situational trading you need experience and knowledge.

Read more at R Blog - RoboForex

Sincerely,
RoboForex team

Re: RoboForex - Company news and official support

How to Trade the Kicker Candlestick Pattern

Author : Victor Gryazin

https://blog.roboforex.com/wp-content/uploads/2023/04/21.04.2023-1536x864.jpg

Dear Clients and Partners,

In this review, we will get acquainted with a rather rare reversal candlestick pattern called Kicker. We will consider the features of its formation and the rules of trading with it.

How a Kicker candlestick pattern is formed

The Kicker candlestick pattern is not often seen on price charts and portends a reversal of the current trend, showing a sudden change in market sentiment. It is usually caused by important or unexpected news related to an asset.

A pattern consists of two candles of different colours: if the first is white, the second is black, and vice versa. The size of the body of the candles does not particularly matter. The body of the first candle follows the direction of the current trend, and the second candle opens with a gap from the opening price of the first candle and closes in the opposite direction.

The peculiarity of this pattern is that the second candle opens immediately with a large gap against the direction of the trend. If the first candle of the pattern is "bearish", the gap widens, and a white candle appears; if the first candle is "bullish", the gap shrinks, and a black candle follows. The gap covers the whole body of the first candle and forms a gap with its opening price.

A bullish Kicker candlestick pattern

This forms on the price chart during a downtrend when there is an active downward price movement and local lows are formed. First, the first black candle of the pattern appears, then the second candle opens with a large gap upwards and closes in white, showing growth. The "bears" were moving the market down, confident in their strength, but unexpected positive news strongly influenced market participants, and the situation changed dramatically. Now, the "bulls" have taken the initiative.

Thus, a bullish candlestick pattern Kicker has been formed on the chart. It is fully formed after the closing of the second candle with a white body, and it is assumed that the bulls, having received unexpected support and going on the offensive, will continue to move the price upwards. Thus, we can expect a severe upward correction or even a reversal and the start of a bullish trend.

https://blog.roboforex.com/wp-content/uploads/2023/04/Kicker-1.png

Bearish candlestick pattern Kicker

This forms on the price chart during an uptrend, which is when there is a strong upward price movement and local highs are formed. First, the first white candle of the pattern appears, then the second candle opens with a large downward gap and closes in black, showing a decline. "The bulls" had been driving the market upwards with a strong initiative, but unexpected negative news strongly influenced the market participants, and the situation changed dramatically: now the bears have taken the initiative.

So, a bearish Kicker candlestick pattern has been formed on the chart. It is fully formed after the second candle closes with a black body, and it is expected that the "bears", having received unexpected support and going on the offensive, will continue to move the quotes downwards. Thus, we can expect a severe downtrend or even a reversal and the start of a bearish trend.

How to buy on a bullish Kicker pattern

  • During a downtrend, a bullish Kicker pattern forms on the price chart.

  • It is recommended to open a buy position at the opening of the next candle after forming the pattern. Stop Loss can be set at the low of the first black candle.

  • The Fibonacci retracement lines and significant resistance levels can be used to set Take Profit.

Read more at R Blog - RoboForex

Sincerely,
RoboForex team

Re: RoboForex - Company news and official support

How Should a Beginner Prepare a Trading Plan?

Author : Victor Gryazin

https://blog.roboforex.com/wp-content/uploads/2021/03/4.jpg

Dear Clients and Partners,

In this overview, we will discuss preparing trading plans. A trading plan helps evaluate the current market situation and make the trader’s plans come to life.

What is a trading plan necessary for?

A trading plan is something like a road map for traders. Based on the trading strategy that you use, a trading plan formulates existing trading opportunities and promising trades. Promising trades are those that have a high probability of a success; they are made in the right place, at the right time, with a moderate risk and a good potential profit.

A trading plan must describe your trading ideas, your analysis of the current situation in detail. It makes a “picture” of your view on the market on paper (or in a file). On the whole, successful analysis and a correct opinion about the market do not guarantee good trading by themselves, however, your current thoughts can show you the field where you can look for trading ideas.

Having a clear and easy-to-understand trading plan, a trader stops making chaotic emotional trades. They are no more a helpless wood chip on market waves. They set their sails and starts off towards their profit, finding and closing promising trades. Thanks to the plan their trading becomes more efficient.

Preparing the plan

The process of preparation can be split in several steps: technical picture, fundamental factors, additional signals (indicators), risk control, taking the profit. Active traders make trading plans every day in the morning, bringing it to life during the day with necessary corrections and amendments.

Step 1: Technical picture

To evaluate the technical picture in an instrument, we use good old tech analysis. Open the chart of your financial instrument, check several timeframes (starting with larger ones and going down to smaller ones), and mark all the important factors:

  • Trend direction, trend lines

  • Support and resistance levels

  • Tech analysis patterns

  • Additional signals: Fibonacci levels, candlestick combinations, Price Action patterns, various original methods.

After you have marked everything on the chart, find suitable entry points on it by your strategy. Choose signals based on which you will open your position: a breakaway of or a bounce off an important level, exiting a price range, a complete tech analysis pattern, etc. Mark all the entry points and confirming signals in your trading plan.

https://blog.roboforex.com/wp-content/uploads/2021/03/tradingplan-technical-1002x630.png

Step 2: Fundamental factors

The main thing that pushes quotations in the market forward is fundamental news, such as decision on interest rates, publications of macroeconomic indicators, speeches of politicians, etc. Such news provokes volatility and gives guidelines for quotations.

To find out which news will come out and when, use an economic calendar. Open it in the morning and mark important events of the day. After some serious data emerges, a signal to open a position by your trading plan might appear – this is the gist of trading news. Or, on the contrary, you will have to close a profitable position or minimize risks (by pulling the Stop Loss closer) before some data appears.

Step 3: Signals from indicators

These days, there are plenty of indicators that help traders carry out holistic market analysis. Trading indicators are mathematical functions based on price or volumes. They not only help to analyze the market but can also give additional trading signals. Some indicators are good for trends, some – for flats, some are universal.

As a rule, traders use indicators as a supplement to tech analysis. Indicators can give confirming signals for opening positions; show the direction of the trend; give indications for placing Stop Losses and Take Profits. Write down the indicators you use and the opening and closing signal they give in the trading plan.

Read more at R Blog - RoboForex

Sincerely,
RoboForex team

Re: RoboForex - Company news and official support

How to Trade the “Two Moving Averages + Fractals” Strategy

Author : Victor Gryazin

https://blog.roboforex.com/wp-content/uploads/2023/04/28.04.2023-1536x864.jpg

Dear Clients and Partners,

In this overview, we will describe the simple medium-term swing trading strategy “Two Moving Averages + Fractals”. We will explain how it works, how to set the indicators, and how it can be used in trading.

What is swing trading?

Swing trading is a medium-term trading style that implies working with various financial instruments over the course of a few hours to a few weeks. As a rule, swing traders open trades in the direction of the current trend to catch the price movement momentum after the end of a local correction. In their search for trading opportunities, swing traders mainly use technical analysis.

How the “Two Moving Averages + Fractals” strategy works

The strategy uses two moving averages (Moving Average, MA) – the EMA (10) and SMA (30) – to confirm the trading direction and search for trading signals. The MA indicator has long been considered a simple and effective tech analysis tool, which tracks trend movements well. To pinpoint entry and exit points on the price chart, the strategy also uses Bill Williams’ Fractals indicator.

How the strategy works:

  • To find buy signals, the trader needs a downward correction after an upward price impulse. The EMA (10) must be above the SMA (30), confirming the uptrend. During the correction, the price should fall to the SMA (30) and form an uptrend reversal with the formation of a lower fractal – this will be a signal to buy

  • To find sell signals, the trader needs to wait for an upward correction after a downward price impulse. The EMA (10) must be below the SMA (30), confirming the downtrend. During the correction, the quotes must rise to the SMA (30) and form a downward reversal with the formation of an upper fractal – this will be a signal to sell

https://blog.roboforex.com/wp-content/uploads/2023/04/MAandFractals-1-1536x822.png
It should be noted that the Two MAs + Fractals strategy is particularly suitable for trading various financial instruments. The recommended timeframes on the chart are H1, H4, and D1. Trades are made in the direction of the trend at the end of the correction.

How to install the Moving Average and Fractals indicators

To install the indicators on the popular trading platforms MetaTrader 4 and MetaTrader 5, follow the process below:

  1. Open the terminal and log in to your account.

  2. Select the chart of your desired instrument.

  3. From the Main Menu, go to – Insert – Indicators – Trend, and then click on Moving Average.

  4. In the settings window that appears, select the period 10, the colour and width of the line, MA method – Exponential. Click OK to apply the parameters and close the settings window.

  5. Repeat the actions above but in the settings window select the period 30, the colour and width of the line, and the MA method – Simple. Click OK to apply the parameters and close the settings window.

  6. Go to the Main Menu – Insert – Indicators – Bill Williams, choose Fractals

  7. In the setting window that pops up choose the colour and size of the fractals; other parameters are set up automatically. Click OK to apply the parameters and close the setting window.

https://blog.roboforex.com/wp-content/uploads/2023/04/MAandFractals-2-1536x822.png
How to buy with the “Two MAs + Fractals” strategy

  • The market Is in an uptrend, and the EMA (10) is above the SMA (30)

  • During a downward correction, the quotes drop to the SMA (30) and form an upward reversal with the formation of a lower fractal

  • The trader opens a buy position and sets the Stop Loss just below the local low formed by the correction

  • The position is closed when the opposite upper fractal appears on the chart

Read more at R Blog - RoboForex

Sincerely,
RoboForex team

Re: RoboForex - Company news and official support

RoboForex provides access to CFDs on Futures

https://roboforex.com/uploads/img/news/main/roboforex-header.jpg

Dear Clients and Partners,

We are happy to announce the latest expansion of our product line: in addition to the 12,000 instruments already available at RoboForex, you can now trade CFDs on Futures.

This is an excellent opportunity to trade this asset using higher leverage than on an exchange and benefit from the absence of swaps (rollover fees). CFDs on futures at RoboForex are available on MetaTrader 4/5 and R StocksTrader platforms.

Learn more  >

Trade CFDs on futures at RoboForex on the following account types:

https://s1.hostingkartinok.com/uploads/images/2023/05/f8d71f735f708d3b4036c6b894557fa0.png

Start trading with RoboForex, and try out this and other trading assets with competitive conditions:

  • 12,000 trading instruments within nine asset classes

  • Floating spreads from zero points, and fast order execution

  • Minimum deposit from 10 USD

  • Leverage up to 1:2000

https://s1.hostingkartinok.com/uploads/images/2023/05/411de6486bd5fa58d6f7a0a1dd2f3a6b.png

Sincerely,
RoboForex team

Re: RoboForex - Company news and official support

How to Trade the “Base 150” Strategy

Author : Victor Gryazin

https://blog.roboforex.com/wp-content/uploads/2023/05/04.05.23-1536x864.jpg

Dear Clients and Partners,

In this review article, we will talk about the medium-term indicator strategy “Base 150”. We will explain how it works, how to set the indicators, and how the strategy can be used in trading.

How the “Base 150” strategy works

This indicator strategy uses four exponential moving averages (Moving Average, MA) – EMA (6), EMA (25), EMA (150), and EMA (365) – to confirm the trading direction and search for trading signals. This indicator has long been considered a simple and effective tech analysis tool, which helps determine trend movements and support or resistance areas on the price chart.

The name “Base 150” comes from the first version of the strategy, which used only one slow-moving average EMA (150). This trading approach was later improved to include one more moving average EMA (365), but the name remained unchanged. In this strategy, the Moving Averages not only serve as trend indicators but also as dynamic support/resistance levels, which are used to conduct trades.

How the “Base 150” strategy works:

  • To find buy signals for a financial instrument, the quotes should rise above the slow EMA (150) and EMA (365), thereby confirming the uptrend. Next, the trader needs to wait for a downward correction until the price first touches one of the four moving averages, followed by an uptrend reversal – this will be a signal to buy

  • To find sell signals for a financial instrument, the quotes should settle below the slow EMA (150) and EMA (365), thus confirming the downtrend. Then the trader needs to wait for an upward correction until the price first touches one of the four moving averages, followed by a downward reversal – this will be a signal to sell

https://blog.roboforex.com/wp-content/uploads/2023/05/Base150-1-1536x847.png

The “Base 150” strategy is primarily aimed at trading the EUR/USD, GBP/USD, USD/CHF, and USD/JPY currency pairs. However, it is versatile enough and can be used to trade other financial instruments. The recommended timeframes on the chart are H1, H4, and D1. Trades are made in the direction of the trend after the price rebounds from the Moving Averages. Risk management for this strategy implies that possible losses per trade should not exceed 1% of the deposit.

How to set up the Moving Average indicators

To set up the indicators on the popular trading platforms МetaTrader 4 and МetaTrader 5, follow these steps:

  1. Open the terminal and log in to your account.

  2. Select the chart of your desired instrument.

  3. From the Main Menu, go to – Insert – Indicators – Trend, and then click on Moving Average.

  4. In the settings window that appears, select period 6, the colour and width of the line, MA method – Exponential. Click OK to apply the parameters and close the settings window.

  5. Repeat the actions above for the other three moving averages. In the settings window that appears, select the periods 25, 150, and 365, the colour and width of the line, MA method – Exponential. Click OK to apply the parameters and close the settings window.

  6. As a result, the chart will show four Moving Averages – EMA (6), EMA (25), EMA (150), and EMA (365).

https://blog.roboforex.com/wp-content/uploads/2023/05/Base150-2-1536x849.png


How to buy with the “Base 150” strategy

  • The market is in an uptrend, with the quotes and fast-moving averages EMA (6) and EMA (25) rising above the slow-moving averages EMA (150) and EMA (365)

  • The trader waits for a downward correction until the price first touches any of these moving averages, followed by an upward price reversal. Further touches should be ignored as the trade is to be opened only after the very first touch

  • For a more accurate entry when the price touches the moving average, a lower timeframe (e.g. H1 for H4 or H4 for D1) can be used to trace how quotes reverse upwards

  • In case of an upward reversal, a buy position is opened. If there is no reversal, the signal is ignored, and the trader waits for other moving averages to be touched

  • Stop Loss is set just below the local low formed by the correction. The expected Take Profit should be twice the Stop Loss amount

Read more at R Blog - RoboForex

Sincerely,
RoboForex team

Re: RoboForex - Company news and official support

False Signals in Forex: How to Detect and Avoid Them?

Author : Maks Artemov

https://blog.roboforex.com/wp-content/uploads/2020/07/20.jpg

Dear Clients and Partners,

Having opened a position, many traders ponder at the question: “Why did it close with a loss if I seemed to do everything right? Almost all signals by the strategy were there but in the end, the price went in the opposite direction”. The keyword in the question is “almost”. Sometimes the market makes movements that you cannot forecast or calculate, in which case indicators turn out virtually useless. What was the point? What went wrong? The answer is simple: the trading strategy gave a false signal, and the trade turned out losing.

Let us try to make it clear why such things happen and why false signals appear.

Why do false signals emerge?

News is, perhaps, the most frequent reason for false signals. As you know, the market accounts for everything, and before some news is officially published, the quotations react and start moving in a certain direction. Normally, if some preliminary results turn out better than expected (such as the GDP reports), the quotations will grow. However, practice shows that the quotations start growing before the publication of the news itself, and at the renewal of the data, the market makes an abrupt reversal and starts a steep decline.

At this moment, Stop Losses trigger at the positions opened beforehand, and impatient market participants worsen the situation, craving for a swift and large profit. Several minutes after the publication of the news, the market calms down, and the price starts going in the correct direction.

https://blog.roboforex.com/wp-content/uploads/2020/07/news-1-1200x543.png

False breakaways of levels

In tech analysis, the most widespread false signals are false breakaways of levels. There are two options of trading support and resistance levels: to trade bounces off them or their breakaways. Here is where market players get mistaken.

Let us imagine trading bounces off the resistance level. The price reached the level, and the trade decided to open a selling trade. They placed the SL behind the level (in a safe zone) but the price broke the level away and close the trade by the SL.

What do impatient traders do in such cases? Normally, they open an opposite (buying) trade and get their position closed by the SL again. The conclusion is simple: impatience and hurry will never do you good in trading.

https://blog.roboforex.com/wp-content/uploads/2020/07/a-false-breakout-of-the-level-3-1200x542.png

How to avoid false signals?

As I have said above, you will hardly exterminate false signals altogether. But minimizing their number is available to almost any trader, just follow several rules:

When trading the news, check the history

Using fundamental analysis for trading, study the influence of some news on the market historically. Quite often, the market reacts to the same news in the same way, so you can forecast the reaction and make the right decision.

Do not hurry to open an opposite order

If your first position closed by the SL, do not rush at opening an opposite one. In most cases, the market will carry on in the direction of your initial position. Note that you usually open an opposite order not by the strategy but emotionally.

Read more at R Blog - RoboForex

Sincerely,
RoboForex team

Re: RoboForex - Company news and official support

How Does Gold Influence on Forex?

Author : Victor Gryazin

https://blog.roboforex.com/wp-content/uploads/2020/12/8.jpg

Dear Clients and Partners,

Gold is one of the first metals that people learned to mine, process, and use. First gold artifacts belong to the pre-dynastic period in Ancient Egypt, i.e. about 5000 B.C. Thanks to being beautiful, rare, and durable, gold has always been used as a universal exchange means, an analog of money.

In this article, we will discuss how the fluctuations of gold quotations influence the prices on Forex.

Gold standard

The gold standard is a monetary system that emerged as a result of the wide use of gold as a universal currency. The gold standard guarantees that all the issued money can be exchanged for the corresponding amount of gold on demand. In transactions between countries that use the gold standard a fixed exchange rate of the currencies is used, based on the standard.

The gold standard that was in force after WW2 was accepted at a conference in Bretton Woods. According to the international agreement, the USA was committed to providing for the gold standard of 35 USD per troy ounce of gold. Only countries represented by their Central banks got the right to exchange dollars for gold. So, at that time the USD was really supported by gold and acquired the status of the global reserve currency.

The epoch of the gold standard ended in 1971 when the USA abandoned the free exchange of the USD for gold. The main reason for the collapse of the Bretton Woods system is the excessive quantity of dollars issued by the USA that were not supported by gold anymore. Since then, the amount of dollars in the world economy keeps growing, currency rates are set by the market, while gold is growing more expensive every year, renewing all-time highs.

This year, gold set another record, rising above 2,000 USD per troy ounce. And the growth of gold is likely to continue because the USA keeps printing dollars and pouring them into the global economy.

https://blog.roboforex.com/wp-content/uploads/2020/12/gold-990x630.png

Which currencies are influenced by gold?

The price of gold can influence the rates of almost all currencies. Changes in the demand for and supply of gold affect the USD firsthand because the price of gold is usually given in the USD. Also, the dynamics of gold prices significantly influence those countries that produce the metal at a scale, important for their economies.

The US dollar

As long as the US dollar is currently the main global reserve currency, the price of gold is conventionally given in the USD. Gold and the dollar have inverse correlations: if the dollar falls, gold grows, and if gold falls, the dollar grows. Gold is often considered to be a means of protection from inflation: the former grows alongside the latter. The growth of the world gold reserve might drive the USD down.

The role of gold in crises

During economic and geopolitical crises, gold is likely to grow because trust in currencies decreases. Gold is, in essence, the oldest universal currency, not bound to any national currency. Gold is the most important indicator of global economic and political development.

Beginning crises usually entail a slump in the stock market. As a rule, this pushed gold prices upwards. Investors, getting rid of declining stock assets, buy gold to decrease the risks of their investment portfolio, and get protection from the falling of currency rates.

Read more at R Blog - RoboForex

Sincerely,
RoboForex team