Re: Forex Technical Analysis & Forecast by RoboForex
Japanese Candlesticks Analysis 07.09.2022 (EURUSD, USDJPY, EURGBP)
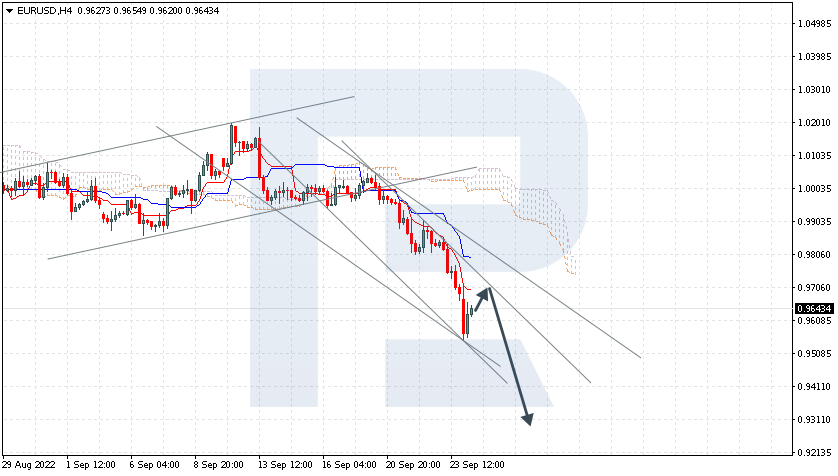
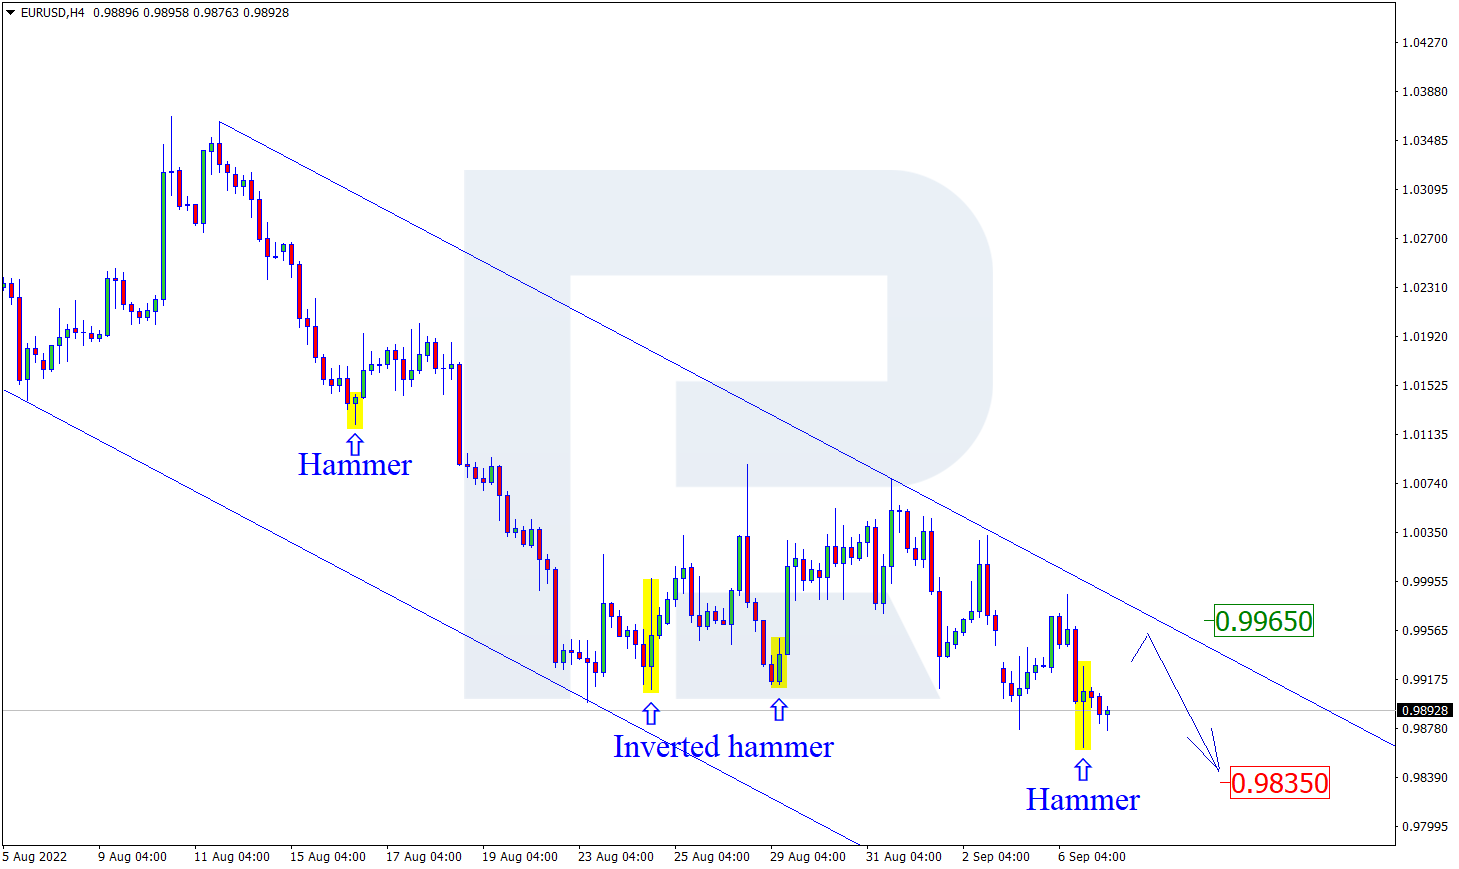
EURUSD, “Euro vs US Dollar”
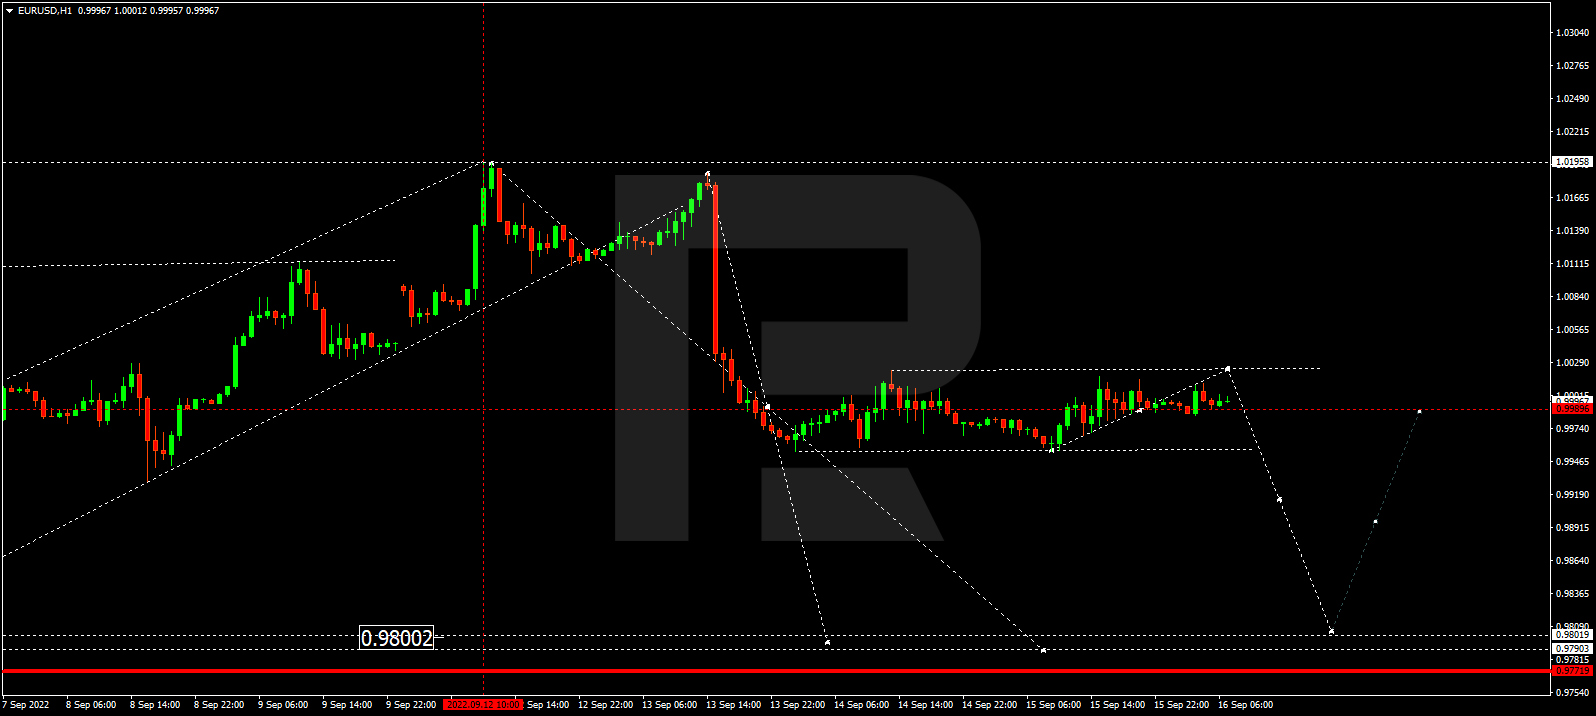
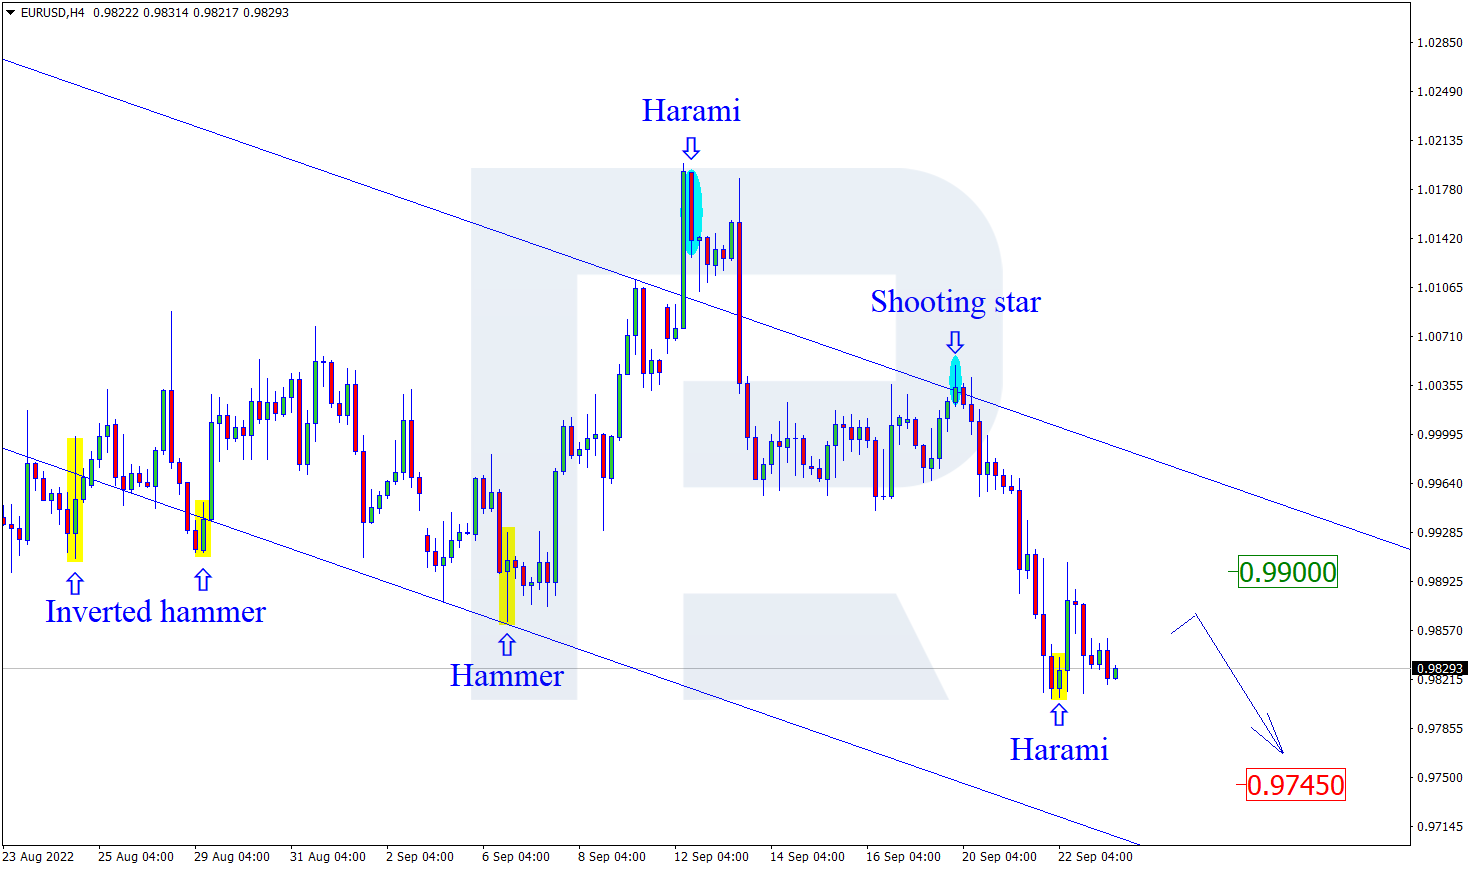
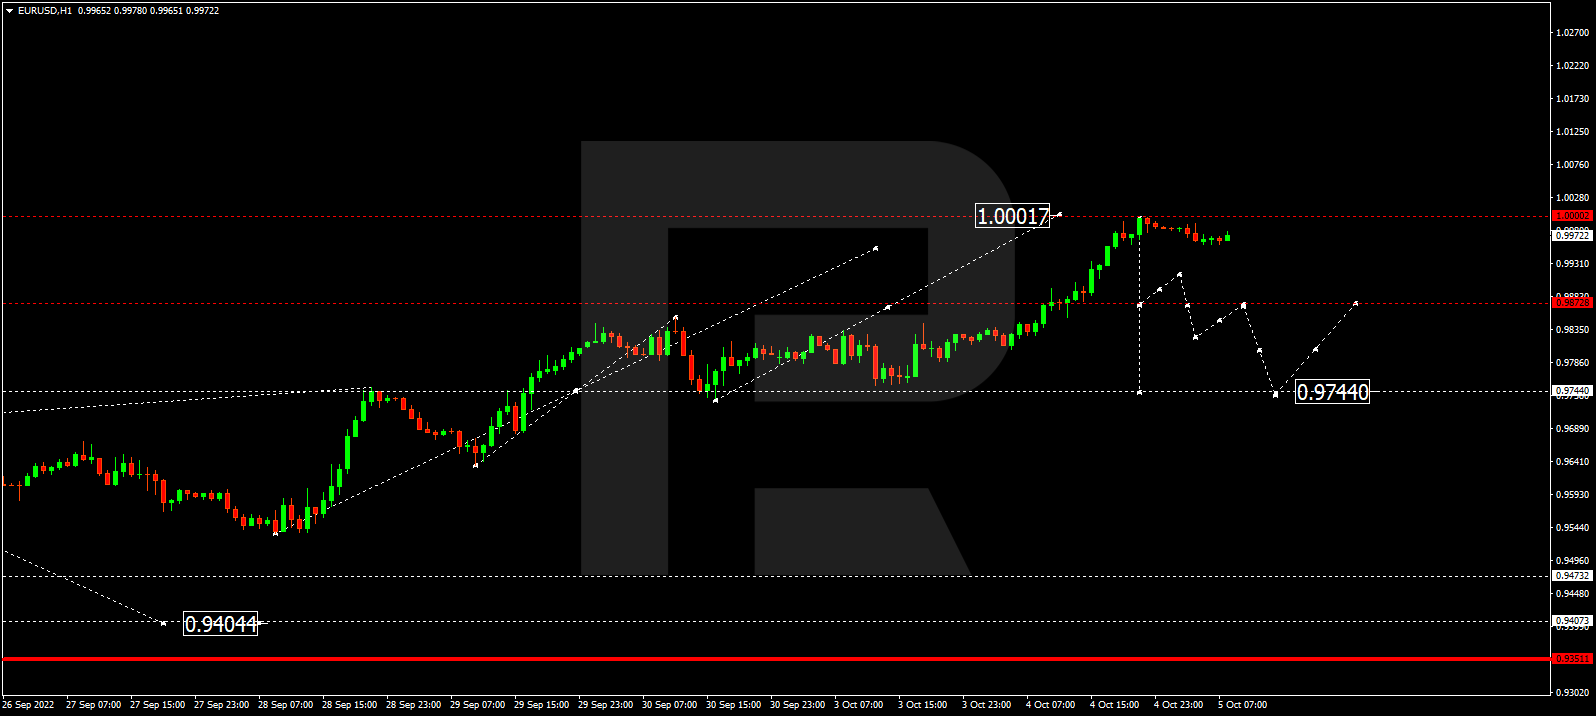
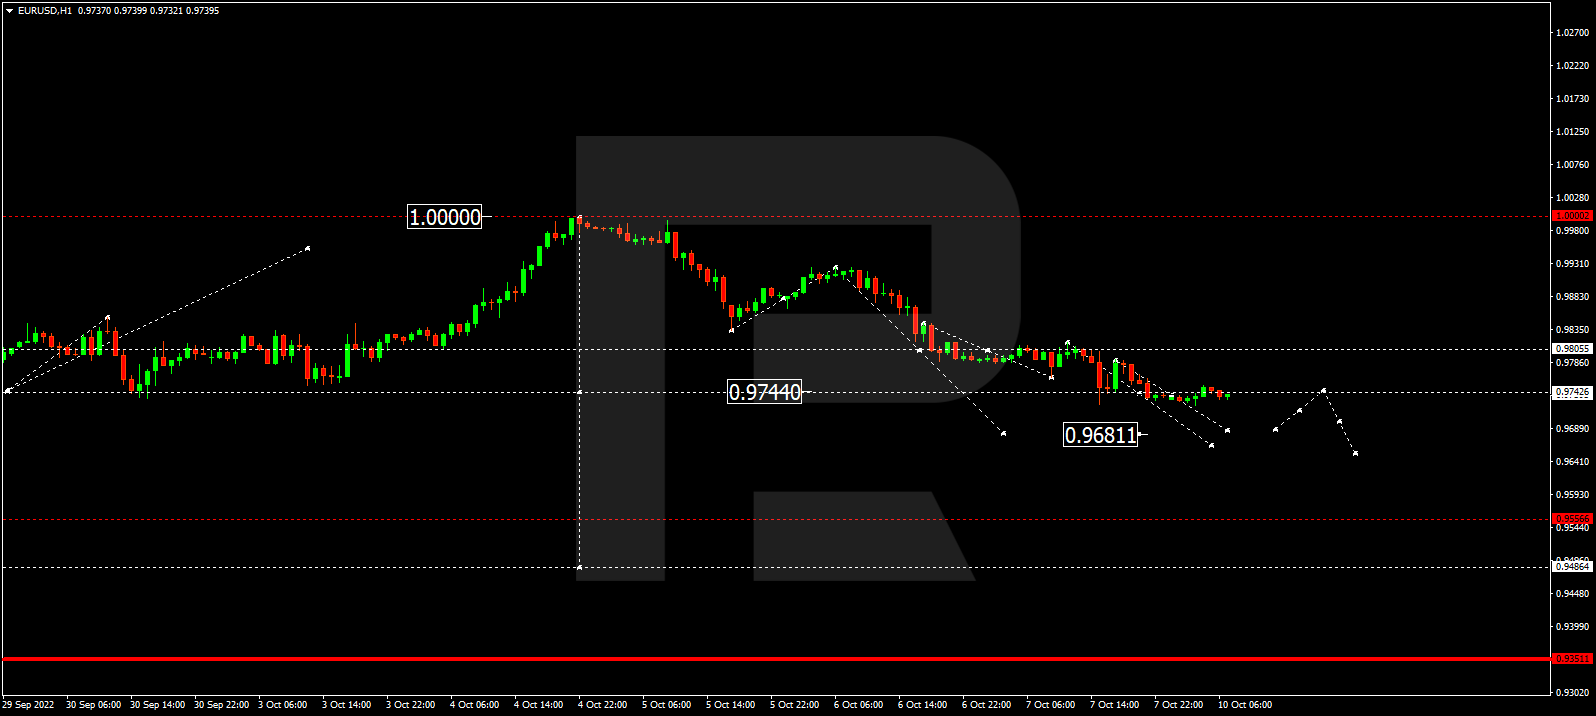
On H4, the pair has formed a reversal Hammer pattern at the support level. The pair can now go by the signal forming an ascending impulse. The goal of the correction might become 0.9965. However, the price may still fall to 0.9835, break through the level, and continue falling without pulling back to the resistance level.
Read more - Japanese Candlesticks Analysis EURUSD, USDJPY, EURGBP