forex software

Create and Test Forex Strategies

forex software

Skip to forum content

Forex Software

Create and Test Forex Strategies

You are not logged in. Please login or register.


(Page 47 of 62)

Forex Software → Market Analysis → InstaForex Analysis

Pages Previous 1 45 46 47 48 49 62 Next

You must login or register to post a reply

RSS topic feed

Posts: 1,151 to 1,175 of 1,547

Re: InstaForex Analysis

Forex Analysis & Reviews: AUDUSD Potential for Bearish Drop | 30th August 2022

https://forex-images.ifxdb.com/userfiles/20220830/analytics630d8a0947ad0.jpg

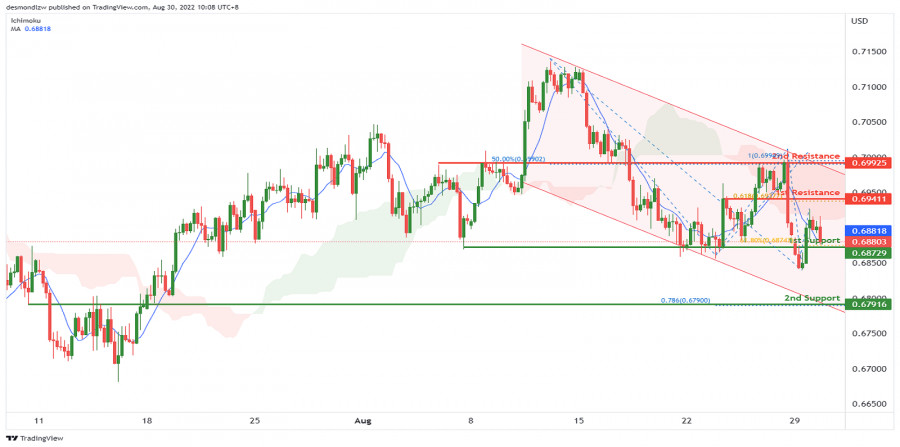
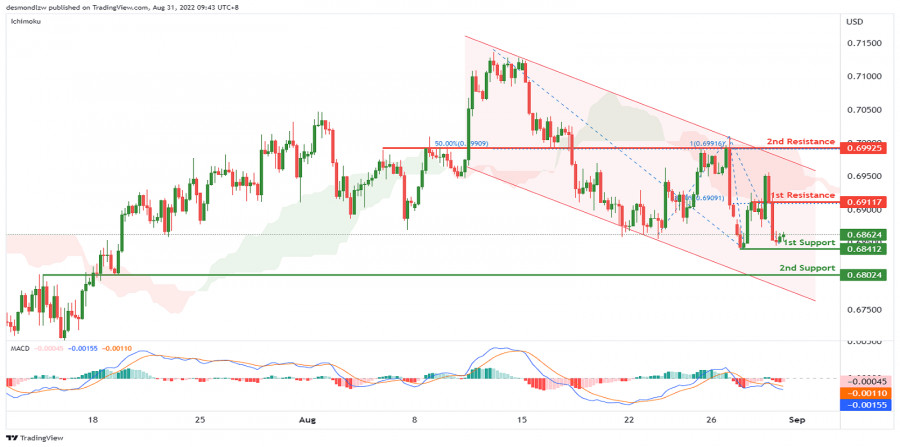
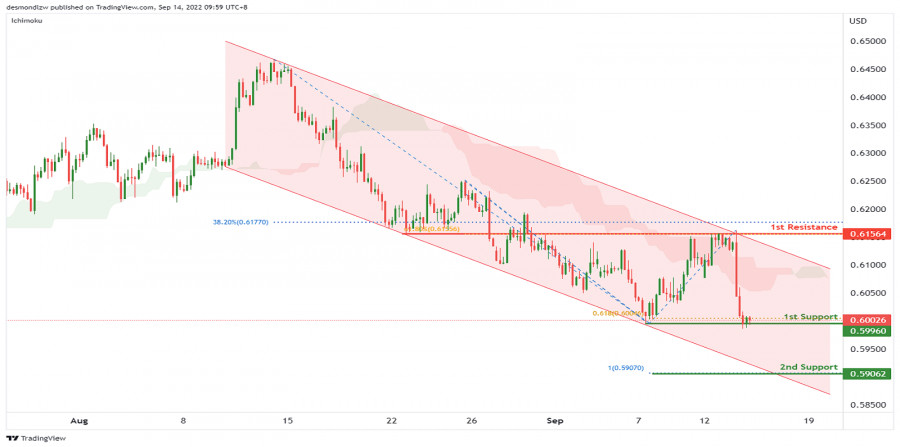
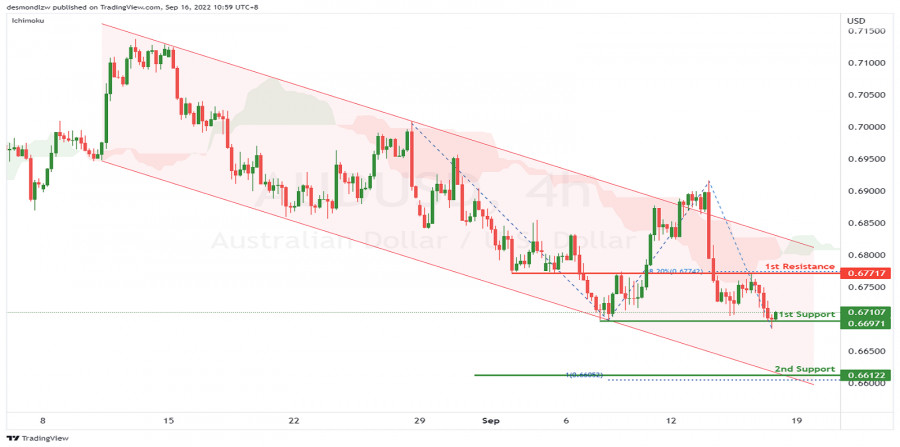
On the H4, with the price moving below the ichimoku cloud and moving within the descending channel, we have a bearish bias that the price may drop from the 1st support at 0.68729, which is in line with the swing lows and 61.8% fibonacci retracement to the 2nd support at 0.67916, where the overlap support and 78.6% fibonacci projection are. Alternatively, the price may rise to the 1st resistance at 0.69411, where the 61.8% fibonacci projection and previous swing high are. If the price can break this resistance level, we can expect the price to rise to the 2nd resistance at 0.69925, where the swing highs, 50% fibonacci retracement and 100% fibonacci projection are.

Trading Recommendation
Entry: 0.68729
Reason for Entry:Swing lows and 61.8% fibonacci retracement
Take Profit:0.67916
Reason for Take Profit: Overlap support and 78.6% fibonacci projection
Stop Loss: 0.69411
Reason for Stop Loss:
61.8% fibonacci projection and previous swing high

*The market analysis posted here is meant to increase your awareness, but not to give instructions to make a trade.

Analysis are provided by InstaForex.

Best regards, PR Manager / Learn more about InstaForex Company at http://instaforex.com

Re: InstaForex Analysis

Forex Analysis & Reviews: AUDUSD Potential For Bearish Drop | 31st August 2022

https://forex-images.ifxdb.com/userfiles/20220831/analytics630ed8189b4f8.jpg

On the H4, with the price moving below the ichimoku cloud, moving within the descending channel and MACD is showing a death cross, we have a bearish bias that the price may drop to the 1st support at 0.68412, which is in line with the swing low to the 2nd support at 0.68024, where the overlap support is. Alternatively, the price may rise to the 1st resistance at 0.69118, where the 38.2% fibonacci retracement and previous swing high are. If the price can break this resistance level, we can expect the price to rise to the 2nd resistance at 0.69925, where the swing highs, 50% fibonacci retracement and 100% fibonacci projection are.

Trading Recommendation
Entry: 0.68412
Reason for Entry: Swing low
Take Profit: 0.68024
Reason for Take Profit: Overlap support
Stop Loss: 0.69118
Reason for Stop Loss:
38.2% fibonacci retracement and previous swing high

*The market analysis posted here is meant to increase your awareness, but not to give instructions to make a trade.

Analysis are provided by InstaForex.

https://www.instaforex.com/forex_analysis/290677

Best regards, PR Manager / Learn more about InstaForex Company at http://instaforex.com

Re: InstaForex Analysis

Forex Analysis & Reviews: Trading Signal for GBP/USD for September 1-2, 2022: buy in case of rebound at 1.1542 (-1/8 Murray - reversal pattern)

https://forex-images.ifxdb.com/userfiles/20220901/analytics63103384d3a24.jpg

Early in the European session, the British Pound (GBP/USD) is trading at around 1.1574. We can see the formation of a symmetrical triangle on the 4-hour chart. If the pound manages to break above this pattern, we could expect a bullish acceleration towards the 21 SMA located at 1.1670.

The British pound is under downward pressure due to the gloomy outlook for the British economy.

Earlier this month, the Bank of England forecast that the British economy would enter a prolonged recession from the fourth quarter of 2022. This suggests that in the medium term the pound could reach the psychological level of 1.15 and even the low of 2020 at 1.1410.

The GBP/USD pair is trading below the 21 SMA located at 1.1670 and below the 200 EMA located at 1.1957. Any technical bounce towards these levels will be seen as an opportunity to sell.

On the 4-hour chart, we can see the formation of a downtrend channel since August 8. In case the downside pressure continues, a technical bounce around the bottom of the downtrend channel is expected around 1.1542.

Technically, GBP/USD is under strong bearish pressure and is trading around -1/8 of Murray at 1.1598. This Murray level represents a technical reversal zone.

In the event that the pound resumes its bullish cycle, we should expect it to trade above 1.1596 (-1/8 Murray), which could set the stage for a recovery in GBP and it could reach the top of the downtrend channel at around 1.1780.

On the other hand, if the pound continues its downward acceleration, it is expected to fall towards the area of around 1.1542. There is daily support and it could even reach -2/8 of Murray located at 1.1475.

Our trading plan for the next few hours suggests a sharp break above the symmetrical triangles pattern at around 1.1596 to buy with targets at 1.1670 and 1.1780. *The market analysis posted here is meant to increase your awareness, but not to give instructions to make a trade.

Analysis are provided by InstaForex.

Read More

Best regards, PR Manager / Learn more about InstaForex Company at http://instaforex.com

Re: InstaForex Analysis

Forex Analysis & Reviews: Technical Analysis of GBP/USD for September 2, 2022

https://forex-images.ifxdb.com/userfiles/20220902/analytics6311a10329add.jpg

Technical Market Outlook:
The GBP/USD pair has made another fresh low at the level of 1.1498 and continues to move away from the trend line resistance. The nearest horizontal technical resistance is seen at the level of 1.1622 and this level is the next target for bulls in a case of a local pull-back. The next target for bears is located at the level of 1.1410 (2020 low). The momentum remains weak and negative on the H4 time frame chart, so the larger time frame trend (daily and weekly) remains down until further notice.

Weekly Pivot Points:
WR3 - 1.18043
WR2 - 1.17392
WR1 - 1.17002
Weekly Pivot - 1.16741
WS1 - 1.16351
WS2 - 1.16090
WS3 - 1.15439

Trading Outlook:
The Cable is way below 100 and 200 DMA , so the bearish domination is clear and there is no indication of down trend termination or reversal. The bulls has failed big time to continue the corrective cycle after a big Bearish Engulfing candlestick pattern was made on the weekly time frame chart last week. The next long term target for bears is seen at the level of 1.1410. Please remember: trend is your friend. *The market analysis posted here is meant to increase your awareness, but not to give instructions to make a trade.

Analysis are provided by InstaForex.

Read More

Best regards, PR Manager / Learn more about InstaForex Company at http://instaforex.com

Re: InstaForex Analysis

Forex Analysis & Reviews: Elliott wave analysis of Litecoin for September 5, 2022

https://forex-images.ifxdb.com/userfiles/20220905/analytics631577eca0375.jpg

In late August, we pinpointed the possibility of a Shoulder- Head-Shoulder bottom being built. The right shoulder held support nicely and is now ready to test the neckline resistance at near 65.77. A break above here will activate the bottom formation for a rally towards 85.27 and possibly even closer to the extension target at 100.65.

However, a confirmed bottom could lead to much higher levels in the weeks/months ahead and 100.65 could only be a temporary stop on the way higher.

*The market analysis posted here is meant to increase your awareness, but not to give instructions to make a trade.

Analysis are provided by InstaForex.

Read More

Best regards, PR Manager / Learn more about InstaForex Company at http://instaforex.com

Re: InstaForex Analysis

Forex Analysis & Reviews: Forecast for EUR/USD on September 6, 2022

The euro closed Monday with a slight decrease, not having time to close the gap from the market opening. This was prevented by resistance at 0.9950. The line of the Marlin Oscillator, which forms the convergence, also showed noticeable resistance. This morning the resistance level is overcome, the gap is closed, the euro may resume its decline, but the oscillator is still struggling with the linear support hurdle.

https://forex-images.ifxdb.com/userfiles/20220906/analytics6316b5bd40344.jpg

To develop a downward movement, the price needs to return under the level of 0.9950. Next, we are waiting for the target levels 0.9850 and 0.9752 to be worked out. The price is between the balance and MACD indicator lines on the H4 chart, the Marlin Oscillator is in the negative area. To consolidate the downward momentum after the price goes under 0.9950, it will also need to overcome the MACD line, approximately in the area of 0.9918. It is also possible for the price to move slightly upwards (0.9985) so that the signal line of the Marlin Oscillator reaches the zero line and reverses from it, thus forming a repeated reversal pattern. This main scenario will be broken if the price settles above the resistance level of 1.0020.

https://forex-images.ifxdb.com/userfiles/20220906/analytics6316b5d244cf4.jpg

Analysis are provided by InstaForex.

Read More

Best regards, PR Manager / Learn more about InstaForex Company at http://instaforex.com

Re: InstaForex Analysis

Forex Analysis & Reviews: Trading Signal for GBP/USD for September 7-8, 2022: buy above 1.1474 or 1.1385 (-1/8 Murray - 21 SMA)

https://forex-images.ifxdb.com/userfiles/20220907/analytics631821828aa60.jpg

Early in the European session, the British pound is trading at around 1.1461. GBP/USD is under strong downward pressure. It is likely that if the pair continues to decline, a technical bounce could occur around the bottom of the downtrend channel at 1.1385.

The British pound is trading below the 21 SMA and below -1/8 Murray. As long as it continues to trade within the downtrend channel, GBP/USD is expected to continue its decline and could reach the extremely oversold zone around -2/8 Murray at 1.1230. One factor that keeps the pound weak is that investors are concerned about a possible recession in the UK economy.

According to the daily chart, the GBP/USD pair is entering oversold levels. So, a technical bounce is likely in the coming hours if the pound manages to consolidate above -1/8 Murray located at 1.1474.

On the other hand, a sharp break of the downtrend channel formed since the beginning of August could offer a sustained recovery for the pound and it could even reach the 0/8 Murray area at 1.1718 and could even reach the 200 EMA located at 1.1862.

Conversely, should the pound break the downtrend channel at around 1.1385, it could accelerate its decline below towards the zone of -2/8 Murray at 1.1230.

Our trading plan for the next few hours for GBP/USD is to wait for its consolidation at around 1.1384 to buy or wait for it to consolidate above 1.1474 (-1/8 Murray) and above the 21 SMA around 1.1526 to buy. Above these levels, we expect the British pound to reach the levels of 1.1605 and 1.1718.

*The market analysis posted here is meant to increase your awareness, but not to give instructions to make a trade.

Analysis are provided by InstaForex.

Read More

Best regards, PR Manager / Learn more about InstaForex Company at http://instaforex.com

Re: InstaForex Analysis

Forex Analysis & Reviews: Technical Analysis of GBP/USD for September 8, 2022

https://forex-images.ifxdb.com/userfiles/20220908/analytics631987e09b2b7.jpg

Technical Market Outlook: The GBP/USD pair has hit the level of 1.1410 which is the 7 years low for this pair and the Bullish Engulfing candlestick pattern was made at the H4 time frame chart. The momentum is negative again on the H4 time frame chart, so the larger time frame trend (daily and weekly) remains down until further notice. Please watch closely the further market reaction for the level of 1.1410, because a shallow 100 pips bounce does not terminate the down trend. The bulls need at least to test the level of 1.1717 in order to make a corrective cycle to the upside more probable.

Weekly Pivot Points:
WR3 - 1.15513
WR2 - 1.15077
WR1 - 1.14791
Weekly Pivot - 1.14641
WS1 - 1.14355
WS2 - 1.14205
WS3 - 1.13769

Trading Outlook: The bearish domination is clear and there is no indication of down trend termination or reversal on the GBP/USD market. The bulls has failed big time to continue the corrective cycle after a big Bearish Engulfing candlestick pattern was made on the weekly time frame, so the downside move accelerated. The next long term target for bears is seen at the level of 1.1410 (2020 low). Please remember: trend is your friend.

*The market analysis posted here is meant to increase your awareness, but not to give instructions to make a trade.

Analysis are provided by InstaForex.

Read More

Best regards, PR Manager / Learn more about InstaForex Company at http://instaforex.com

Re: InstaForex Analysis

Forex Analysis & Reviews: Forecast for GBP/USD on September 9, 2022

Yesterday, the pound closed down 30 points on the back of a weakening euro and the death of Queen Elizabeth II. But the central banks reacted extremely quickly and bought the market against the news. The volume of trading in the pound was the largest since July 14.

https://forex-images.ifxdb.com/userfiles/20220909/analytics631aa77497048.jpg

Today, the pound started with growth, the price went above the resistance of 1.1525, on which it has been holding for the fourth day with strong fluctuations in both directions. The Marlin oscillator is growing on the daily scale, the price may reach the target level of 1.1600. But there is also a significant level slightly above it - 1.1650. This creates a danger that the price will quietly reach this level, and then consolidate above it and try to break through to 1.1815. But for now, we do not expect the pound to rise above 1.1600. Data on construction, trade balance and industrial production in the UK will be released on Monday, the forecasts for them are negative.

https://forex-images.ifxdb.com/userfiles/20220909/analytics631aa765aa095.jpg

Analysis are provided by InstaForex.

Read More

Best regards, PR Manager / Learn more about InstaForex Company at http://instaforex.com

Re: InstaForex Analysis

Forex Analysis & Reviews: Elliott wave analysis of GBP/JPY for September 12, 2022

https://forex-images.ifxdb.com/userfiles/20220912/analytics631eafe9314a8.jpg

GBP/JPY is getting absolutely nowhere. The most likely pattern unfolding here is a descending triangle as wave B/. We have apparently seen a top at 166.31 for renewed downside pressure towards the triangle support line near 160.00. A break below here will confirm the next decline towards 154.41.

Short-term a break below minor support at 164.19 will set the stage for a decline towards the triangle support line at 160.00. *The market analysis posted here is meant to increase your awareness, but not to give instructions to make a trade.

Analysis are provided by InstaForex.

Read More

Best regards, PR Manager / Learn more about InstaForex Company at http://instaforex.com

Re: InstaForex Analysis

Forex Analysis & Reviews: Forecast for GBP/USD on September 13, 2022

Yesterday, the pound rose by 93 points, the resistance level of 1.1648 was overcome. Now the price can work out the resistance of the MACD indicator line (1.1755).

https://forex-images.ifxdb.com/userfiles/20220913/analytics631fecf651a5a.jpg

At the same moment, the signal line of the Marlin Oscillator may turn down after touching the border with the growth area. In this case, we expect a decrease below 1.1525. This is the main scenario. Price exit above resistance 1.1815 opens the 1.2005 target.

There is a mini-consolidation of the price after breaking above the level of 1.1648 on the four-hour chart. Probably, this is preparation for working out 1.1755. In any case, whether this residual growth takes place or not, after consolidating under 1.1648, the target 1.1525 will open. The MACD line is approaching this level.

https://forex-images.ifxdb.com/userfiles/20220913/analytics631fecdc41fff.jpg

*The market analysis posted here is meant to increase your awareness, but not to give instructions to make a trade.

Analysis are provided by InstaForex.

Read More

Best regards, PR Manager / Learn more about InstaForex Company at http://instaforex.com

Re: InstaForex Analysis

Forex Analysis & Reviews: NZDUSD Potential for Bearish Drop | 14th September 2022

https://forex-images.ifxdb.com/userfiles/20220914/analytics63214c9514a07.jpg

On the H4, with the price moving within the descending channel and below ichimoku cloud, we have a bearish bias that the price may drop from the 1st support at 0.59960, which is in line with the swing low and 61.8% fibonacci projection to the 2nd support at 0.59062, where the 100% fibonacci projection is. Alternatively, the price may rise to the 1st resistance at 0.61564, which is in line with the overlap resistance, 61.8% fibonacci retracement and 38.2% fibonacci retracement.

Trading Recommendation
Entry: 0.59960
Reason for Entry:Swing low and 61.8% fibonacci projection
Take Profit: 0.59062
Reason for Take Profit: 100% fibonacci projection
Stop Loss: 0.61564
Reason for Stop Loss:
Overlap resistance, 61.8% fibonacci retracement and 38.2% fibonacci retracement

*The market analysis posted here is meant to increase your awareness, but not to give instructions to make a trade.

Analysis are provided by InstaForex.

Read More

Best regards, PR Manager / Learn more about InstaForex Company at http://instaforex.com

Re: InstaForex Analysis

Forex Analysis & Reviews: Forecast for EUR/USD on September 15, 2022

As the market cooled down after an exciting Tuesday, the euro spent Wednesday in consolidation between the target levels of 1.0032 and 0.9950. The price did not even try to fight the resistance, which was also strengthened by the MACD indicator line of the daily scale.

https://forex-images.ifxdb.com/userfiles/20220915/analytics63229077aceb6.jpg

The signal line of the Marlin Oscillator turned down without an attempt to work out the border with the growth territory. This is a good sign of a further decline, which will be confirmed after the price breaks below the 0.9950 support. The nearest target is 0.9850, followed by 0.9752.

https://forex-images.ifxdb.com/userfiles/20220915/analytics63229082bbb91.jpg

The price consolidated under the MACD indicator line and balance lines (red) on the four-hour chart. Marlin shows intention to continue the decline after yesterday's own consolidation. The situation is completely downward.

*The market analysis posted here is meant to increase your awareness, but not to give instructions to make a trade.

Analysis are provided by InstaForex.

Read More

Best regards, PR Manager / Learn more about InstaForex Company at http://instaforex.com

Re: InstaForex Analysis

Forex Analysis & Reviews: AUDUSD Potential for Bearish Drop | 16th September 2022

https://forex-images.ifxdb.com/userfiles/20220916/analytics6323fdb283795.jpg

On the H4, with the price moving within the descending channel and below ichimoku cloud, we have a bearish bias that the price may drop to the 1st support at 0.67105, which is in line with the swing low. If the 1st support level is broken, the 2nd support could be at 0.66122, where the 100% fibonacci projection is. Alternatively, the price may rise to the 1st resistance at 0.67717, which is in line with the 38.2% fibonacci retracement and overlap resistance.

Trading Recommendation
Entry: 0.67105
Reason for Entry: Swing low
Take Profit: 0.66122
Reason for Take Profit: 100% fibonacci projection
Stop Loss: 0.67717
Reason for Stop Loss:
38.2% fibonacci retracement and overlap resistance

*The market analysis posted here is meant to increase your awareness, but not to give instructions to make a trade.

Analysis are provided by InstaForex.

Read More

Best regards, PR Manager / Learn more about InstaForex Company at http://instaforex.com

Re: InstaForex Analysis

Forex Analysis & Reviews: Forecast for GBP/USD on September 19, 2022

GBP/USD hit the the target level of 1.1385 on Friday. Today is a holiday in the UK, so there is little chance that a similar scenario will be repeated. But if it happens, the pair will reach the target level of 1.1305.

https://forex-images.ifxdb.com/userfiles/20220919/analytics6327d57fadc4d.jpg

So far, the quote is nearing the area of the Marlin oscillator, which may result in a rise to 1.1648 or a long correction. If a convergence does not happen, the pair will go under 1.1305 and head towards 1.1250, then climb to 1.083.

https://forex-images.ifxdb.com/userfiles/20220919/analytics6327d59b9afcf.jpg

In the four-hour (H4) chart, the pair is under the balance and MACD lines, which suggests that a correction to 1.1525 is still possible. And if the quote stays above the MACD line, the pair will grow further to 1.1648. But for now, the nearest target is a consolidation under 1.1385.

*The market analysis posted here is meant to increase your awareness, but not to give instructions to make a trade.

Analysis are provided by InstaForex.

Read More

Best regards, PR Manager / Learn more about InstaForex Company at http://instaforex.com

Re: InstaForex Analysis

Forex Analysis & Reviews: Forecast for EUR/USD on September 20, 2022

The euro rose slightly on Monday, supporting the strong resistance of the target level of 1.0032 and the MACD indicator line coinciding with it. This morning the resistance was pierced, but it is unlikely that speculators will decide to develop the movement before tomorrow's Federal Reserve meeting.

https://forex-images.ifxdb.com/userfiles/20220920/analytics632929a9e2e06.jpg

But the Fed meeting should be "soft" so that the counter-dollar market shifts to growth, and we do not expect a soft meeting, since the rate will be raised by 0.75%, according to the FOMC members themselves, and the committee's forecasts on inflation and future rates in light of the current situation is unlikely to be weak.

We are waiting for the price to reverse from the achieved resistance to the nearest support at 0.9950. Next, we are waiting for the price to decline to the support of 0.9850. The Marlin Oscillator has penetrated into the growth zone, but this movement seems to be false so far.

https://forex-images.ifxdb.com/userfiles/20220920/analytics6329298e499d4.jpg

The price is trying to consolidate above 1.0032 on the four-hour chart, the Marlin Oscillator is in the positive area. Formally, the technical situation favors the euro's further growth, but before the Fed meeting, we will refrain from both buying and premature selling. *The market analysis posted here is meant to increase your awareness, but not to give instructions to make a trade.

Analysis are provided by InstaForex.

Read More

Best regards, PR Manager / Learn more about InstaForex Company at http://instaforex.com

Re: InstaForex Analysis

Forex Analysis & Reviews: Forecast for USD/JPY on September 21, 2022

On Tuesday, the USD/JPY pair added 54 points amid an overall strengthening of the dollar by 0.53%. The US stock market lost more than 1% of capitalization yesterday (S&P 500 -1.13%, Russell 2000 -1.36%), but investors are still guided by the situation with the dollar. We believe that after the hype subsides after the Federal Reserve's rate hike, the yen may strengthen under the pressure of stock indices.

https://forex-images.ifxdb.com/userfiles/20220921/analytics632a766a7f044.jpg

While we are waiting for the price to rise to the nearest target of 145.10 - to the embedded line of the global price channel, if it is overcome, the growth will continue to the next line at 147.10. A price divergence with the Marlin Oscillator is possible in the area of the second target. This will be a sign of a trend reversal. The price is consolidating under the MACD line (143.83) on the four-hour chart. Consolidating above it, as an initial success, will push the price to storm 145.10. The Marlin Oscillator is moving sideways in the positive area. We are waiting for the Fed's decision and the dollar's growth against the yen

https://forex-images.ifxdb.com/userfiles/20220921/analytics632a76768f5da.jpg

*The market analysis posted here is meant to increase your awareness, but not to give instructions to make a trade.

Analysis are provided by InstaForex.

Read More

Best regards, PR Manager / Learn more about InstaForex Company at http://instaforex.com

Re: InstaForex Analysis

Forex Analysis & Reviews: Forecast for EUR/USD on September 22, 2022

After the euro's decline by 134 points yesterday, the price continues to decline under the target level of 0.9850 in today's Asian session. The inertial decline may continue to the level of 0.9752, from which we expect a reversal into a correction.

https://forex-images.ifxdb.com/userfiles/20220922/analytics632bd2d562526.jpg

Correction from 0.9752 on the technical side may be due to the emerging extended convergence with the Marlin Oscillator. It also appears on the weekly chart. If the price still manages to consolidate under 0.9752, then the euro is waiting for the underlying levels of 0.9692 and 0.9625.

In the long term, we look at the euro's fall to the levels of the winter 2002 area, to the 0.8600 area, which would correspond to a Fibonacci reaction level of 200.0% on the monthly scale chart.

https://forex-images.ifxdb.com/userfiles/20220922/analytics632bd2e5b9f65.jpg

The price has consolidated below 0.9850 on the 4-hour chart, Marlin is in the negative area, but is already making the first attempts to slow down this decline. We are waiting for the price at the target level of 0.9752.

*The market analysis posted here is meant to increase your awareness, but not to give instructions to make a trade.

Analysis are provided by InstaForex.

Read More

Best regards, PR Manager / Learn more about InstaForex Company at http://instaforex.com

Re: InstaForex Analysis

Forex Analysis & Reviews: Forecast for EUR/USD on September 23, 2022

Yesterday, the euro closed the day at the opening level. The closure occurred under the resistance of 0.9850 and formally this means consolidating under the level. But since there is practically no body of the candle, the consolidation itself is formless, weak. At the same time, convergence is also formed with the Marlin Oscillator.

https://forex-images.ifxdb.com/userfiles/20220923/analytics632d1c8ec114c.jpg

A slight increase in the price is visible this morning, with the intention to go above 0.9850. Consolidating above the level opens the way to 0.9950. It is possible to continue growth to the 1.0032 level. All this growth will occur in the general direction of the downward trend. Upon completion of the correction, a new wave of medium-term decline will begin to develop. In this case, the key level of 0.9752 that we noted will be overcome with more energy, the price will try to settle at 0.9692 and go below (0.9625).

https://forex-images.ifxdb.com/userfiles/20220923/analytics632d1c9a61536.jpg

The strong growth of the Marlin Oscillator indicates the beginning of the correction on the four-hour chart. Consolidating above 0.9850, and with it the transition of Marlin to a positive area will create a technical basis for further growth to the target level of 0.9950. A little below the 1.0032 level is the MACD line. If the price rises, this line will turn up, press against the linear level, strengthen it and create tension by the end of the correction. It will also turn out that in the area of 1.0032, the MACD lines of both scales will coincide, which will also strengthen the resistance. A puncture of this level is possible to 1.0051, to the high of September 20, but this puncture will already be false. This is the main scenario. An alternative scenario allows the price to rise to the upper area of a prolonged and broad consolidation of August-September at 1.0150.

*The market analysis posted here is meant to increase your awareness, but not to give instructions to make a trade.

Analysis are provided by InstaForex.

Read More

Best regards, PR Manager / Learn more about InstaForex Company at http://instaforex.com

Re: InstaForex Analysis

Forex Analysis & Reviews: Forecast for GBP/USD on September 26, 2022

The British pound fell by an incredible 417 points (-3.65%) on Friday, reaching strong support from the 1.0830 price level and price channel line of the monthly timeframe. This morning, during the first four hours of the trading session, the price fell by another 490 points in the moment, winning back half of the fall in the next half hour.

https://forex-images.ifxdb.com/userfiles/20220926/analytics6331137d72ac8.jpg

Now the price is between the target levels of 1.0310 and 1.0535. The Marlin Oscillator is in the oversold zone, the ultra-high volatility of the pound indicates its potential correction in the near future. The optimal strategy in this situation would be to wait for the correction to be completed and then open new short positions. The nearest target at 1.0310, formed by the embedded line of the price channel, remains unworked out. Leaving the area under it opens the 1.0140 target.

https://forex-images.ifxdb.com/userfiles/20220926/analytics633113890dda5.jpg

On a four-hour scale, the Marlin Oscillator is already headed for a correction - the price is consolidating under the level of 1.0535. We are waiting for the correction to be completed, the market to be calm, and the price to move down further.

*The market analysis posted here is meant to increase your awareness, but not to give instructions to make a trade.

Analysis are provided by InstaForex.

Read More

Best regards, PR Manager / Learn more about InstaForex Company at http://instaforex.com

Re: InstaForex Analysis

Forex Analysis & Reviews: Forecast for GBP/USD on September 27, 2022

Yesterday, the pound fell on Friday's example, but this time, after a decline of 487 points, there was a strong rebound of 570 points. The day was still closed with a black candle.

https://forex-images.ifxdb.com/userfiles/20220927/analytics63326501203e5.jpg

The lower shadow still did not reach the target level of 1.0310. Now there is a consolidation under the level of 1.0830. Upon completion of the consolidation, we are waiting for a new wave of decline to 1.0310. Intermediate level of 1.0535.

https://forex-images.ifxdb.com/userfiles/20220927/analytics633264e2be1c1.jpg

On the four-hour chart, the price reverses before the resistance level of 1.0830, and the Marlin Oscillator also reverses. If the price does not change its mind and decreases from the current levels (without re-working out 1.0830), then we are waiting for it at the first target of 1.0535.

*The market analysis posted here is meant to increase your awareness, but not to give instructions to make a trade.

Analysis are provided by InstaForex.

Read More

Best regards, PR Manager / Learn more about InstaForex Company at http://instaforex.com

Re: InstaForex Analysis

Forex Analysis & Reviews: Trading Signal for Gold (XAU/USD) On September 28-29, 2022: buy above $1,625 or in case of rebound at $1,600 (0/8 Murray - oversold)

https://forex-images.ifxdb.com/userfiles/20220928/analytics6333cc8f217e2.jpg

Since the beginning of August, gold (XAU/USD) has been trading inside a downtrend channel. It is likely to find support around 0/8 Murray (1,625).

Gold reached the low of April 05, 2020, at 1,621.01. It is currently trading near these levels and is showing levels of consolidation.

Some members of the FED are supporting further increases in interest rates, even at the risk of slowing economic growth. On Friday, the president of the Federal Reserve Bank of Philadelphia said that he believed that the US central bank could reduce inflation without causing a deep recession and high unemployment.

Yesterday, in the American session, gold made a brief recovery and reached 1,642.33. As it failed to consolidate gains, it changed course and now is facing a decision to break the critical support of 1,625.

In the event of a drop below 1,624, it will head towards the next level of 1,610 and could even drop towards the psychological level of 1,600.

Conversely, a sharp break above the 21 SMA could accelerate the upside momentum and the price could reach the top of the downtrend channel around 1,656-1,662.

According to the 4-hour chart, the outlook remains negative for gold. In case of extending the bounce, the resistances could be located at 1,641, followed by 1,656. A drop below 1,625 in the short term would expose the area of recent lows and the next support at 1,600.

Our trading plan for the next few hours is to buy XAU/USD only if it trades above 0/8 Murray (1,625) or if there is a technical bounce off the bottom of the downtrend channel around 1,600. With targets at 1,625,1,645 and 1,656.

*The market analysis posted here is meant to increase your awareness, but not to give instructions to make a trade.

Analysis are provided by InstaForex.

Read More

Best regards, PR Manager / Learn more about InstaForex Company at http://instaforex.com

Re: InstaForex Analysis

Forex Analysis & Reviews: Forecast for EUR/USD on September 29, 2022

Yesterday there was a sharp and strong correction in the yields of US government bonds. Yields on 5-year bonds fell from 4.19% to 3.97%, returning to levels of the 23rd. Following the yields, the stock market also corrected – the S&P 500 grew by 1.97%. Oil and gold rose. The euro added 143 points. The price reached the target level of 0.9752, reversed from it and is now breaking through the support at 0.9695.

https://forex-images.ifxdb.com/userfiles/20220929/analytics633505803e562.jpg

We believe that the correction has ended due to the large price growth and strong resistance. The signal line of the Marlin Oscillator turned down. We are waiting for the price to overcome the supports 0.9625, 0.9520 and reach the level 0.9404. We expect a longer correction from this level. It is close to the February 2000 low (0.9399), which, taking into account the error in the 22-year history, can be taken as coinciding levels. On the four-hour chart, the price is trying to consolidate below the level of 0.9695. The Marlin Oscillator is trying to move back into negative territory. We also note that yesterday's growth occurred under the balance indicator line (red), which indicates a purely corrective nature of this movement.

https://forex-images.ifxdb.com/userfiles/20220929/analytics6335058c3e220.jpg

Analysis are provided by InstaForex.

Read More

Best regards, PR Manager / Learn more about InstaForex Company at http://instaforex.com

Re: InstaForex Analysis

Forex Analysis & Reviews: Trading Signal for GBP/USD on September 30, 2022: sell below 1.1230 (21 SMA - 7/8 Murray)

https://forex-images.ifxdb.com/userfiles/20220930/analytics63366ff500eea.jpg

The British pound is trading around 1.1144. We can see three consecutive days of recovery and now it is facing the zone of 7/8 Murray (1.1230) which represents a likely technical reversal.

A pullback towards the 1.1310 area (200 EMA) or towards the 1.1230 level (7/8) could be considered as a signal to resume selling.

According to the daily chart, we can see that the British pound has three days of strong recovery and could now face overbought levels.

This recovery could be momentary, as the main trend is still bearish and its rise higher will be seen by the bears as a good opportunity to sell.

The intervention of the Bank of England caused strong volatility in the GBP/USD pair, which led to a recovery of almost 900 points. The BoE announced that it will make temporary purchases of UK bonds. This intervention will only relieve downward pressure momentarily, as the Fed is determined to raise its interest rate in the coming months.

Therefore, we can sell the pound below the area of 7/8 Murray or the 200 EMA with targets at 6/8 around 1.0742.

Additionally, the psychological level of 1.10 will be the key level for the British pound. We expect the British pound to trade around this area in the coming days and it could be seen as a pivot point in the event of a bullish or bearish move.

*The market analysis posted here is meant to increase your awareness, but not to give instructions to make a trade.

Analysis are provided by InstaForex.

Read More

Best regards, PR Manager / Learn more about InstaForex Company at http://instaforex.com

Re: InstaForex Analysis

Forex Analysis & Reviews: Forecast for EUR/USD on October 3, 2022

Last Friday, the euro traded within the range of target levels 0.9752-0.9850, closing the day down 12 points. The daily Marlin Oscillator turned sideways – to the neutral state, even though it is in the negative territory.

A debt crisis is brewing in Europe, which began with a rise in yields on British medium-term government bonds, in particular, on 3-year securities over the last ten days of September, it jumped from 3.05% to 4.74%. For German 3-year bonds, during this time, the yield increased from 1.54% to 1.80%. Given the European Central Bank's intention to raise rates sharply at the October meeting, anxiety will only intensify. But maybe not today or tomorrow.

https://forex-images.ifxdb.com/userfiles/20221003/analytics633a4c1e0ae57.jpg

The eurozone is expected to have a neutral PMI in the manufacturing sector for September - that is, it will remain at its previous value of 48.5 points, while the US ISM Manufacturing PMI is forecast to weaken from 52.8 to 52.2. As a result, we expect some more delay for the euro in the range of 0.9695-0.9850. Perhaps, having the price settle under 0.9695, that is, under the close on September 23, when the euro collapsed by 150 points, the trend will strengthen in a new downward momentum.

https://forex-images.ifxdb.com/userfiles/20221003/analytics633a4c06141f8.jpg

MACD indicator lines, which also indicates the possibility of the price staying in the side short-term trend. The Marlin Oscillator has turned down, but not enough yet, given the overall technical picture, for the effectiveness of such a signal.

The probability of continuation of the correction to the level of 0.9950, which has already reached and significantly strengthened the MACD line of the daily scale, is 35%. We will allocate 50% for sideways movement and 15% for downward reversal. *The market analysis posted here is meant to increase your awareness, but not to give instructions to make a trade.

Analysis are provided by InstaForex.

Read More

Best regards, PR Manager / Learn more about InstaForex Company at http://instaforex.com

Posts: 1,151 to 1,175 of 1,547

Pages Previous 1 45 46 47 48 49 62 Next

You must login or register to post a reply

Forex Software → Market Analysis → InstaForex Analysis

Similar topics in this forum