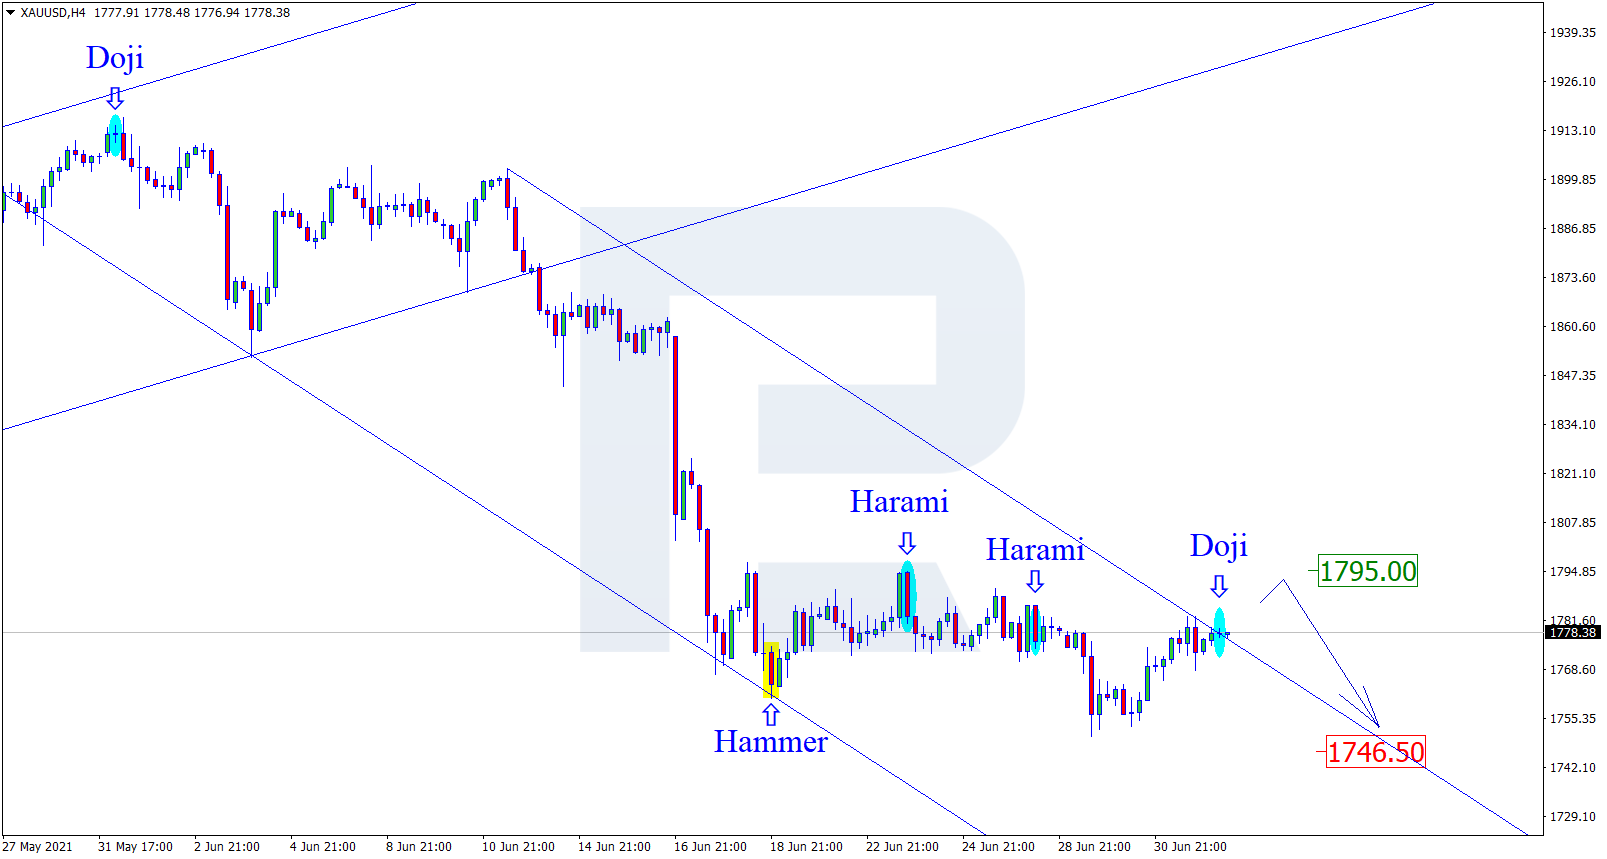
Re: Forex Technical Analysis & Forecast by RoboForex
Fibonacci Retracements Analysis 01.07.2021 (Brent, Dow Jones)
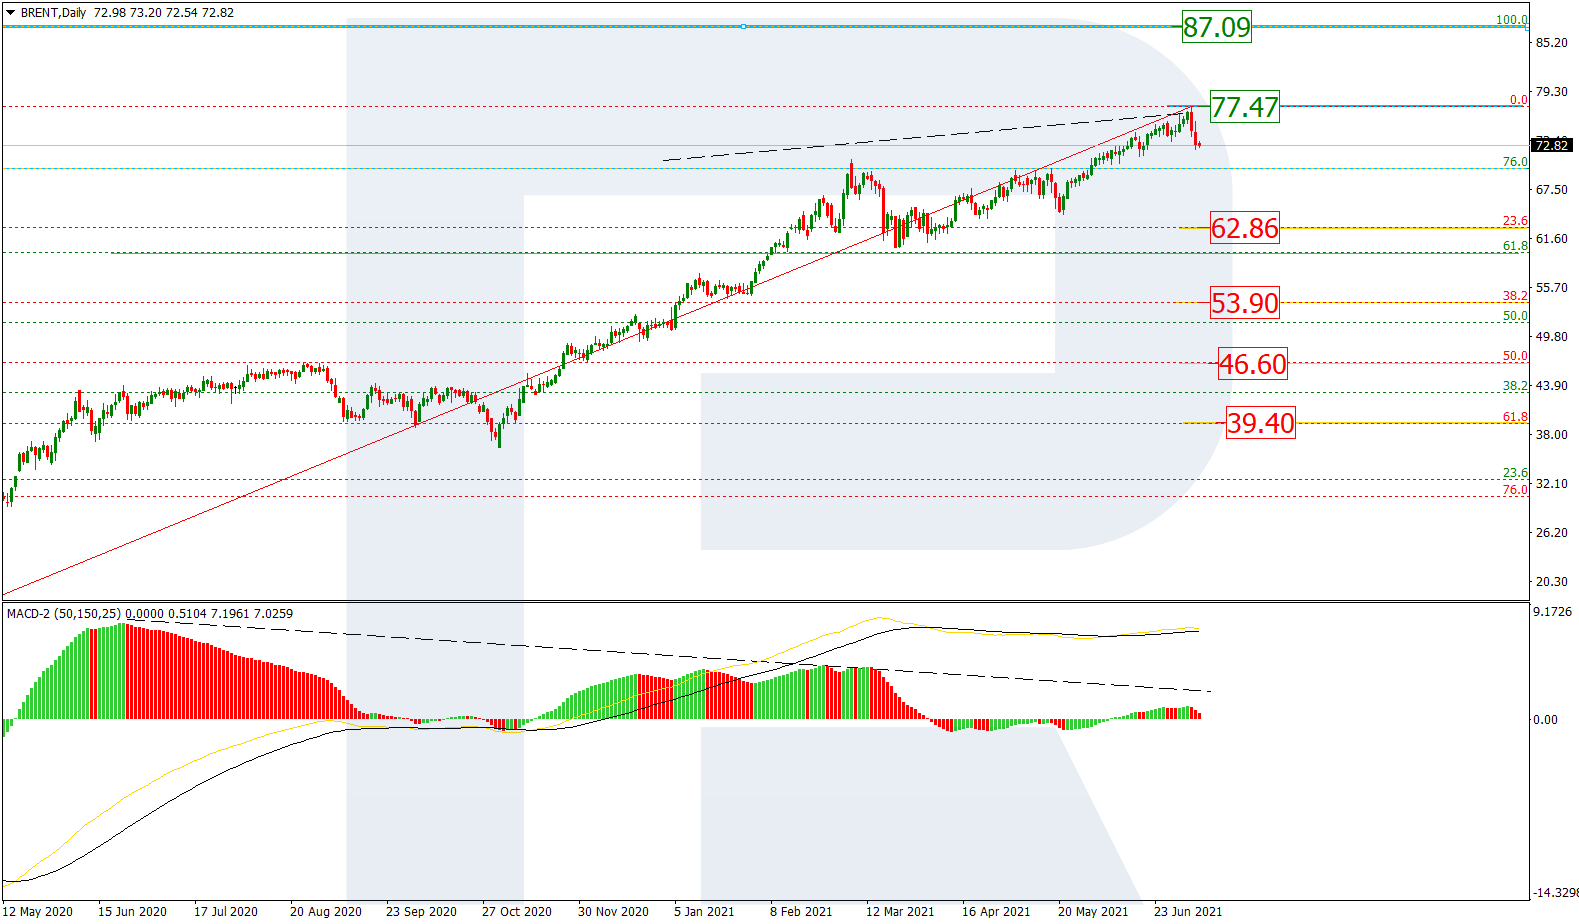
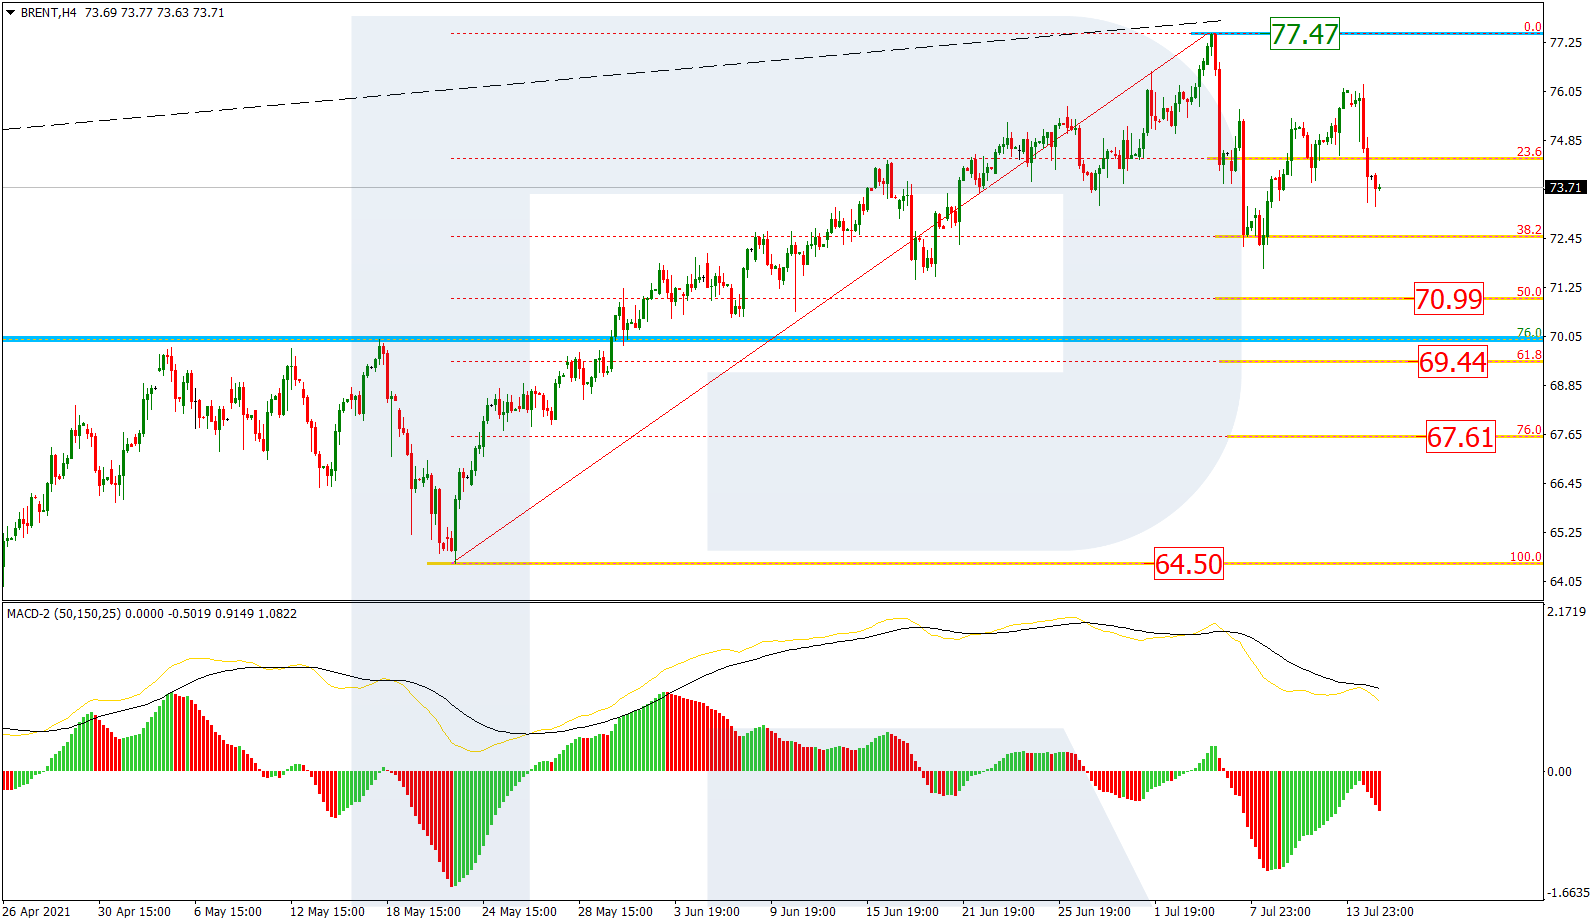
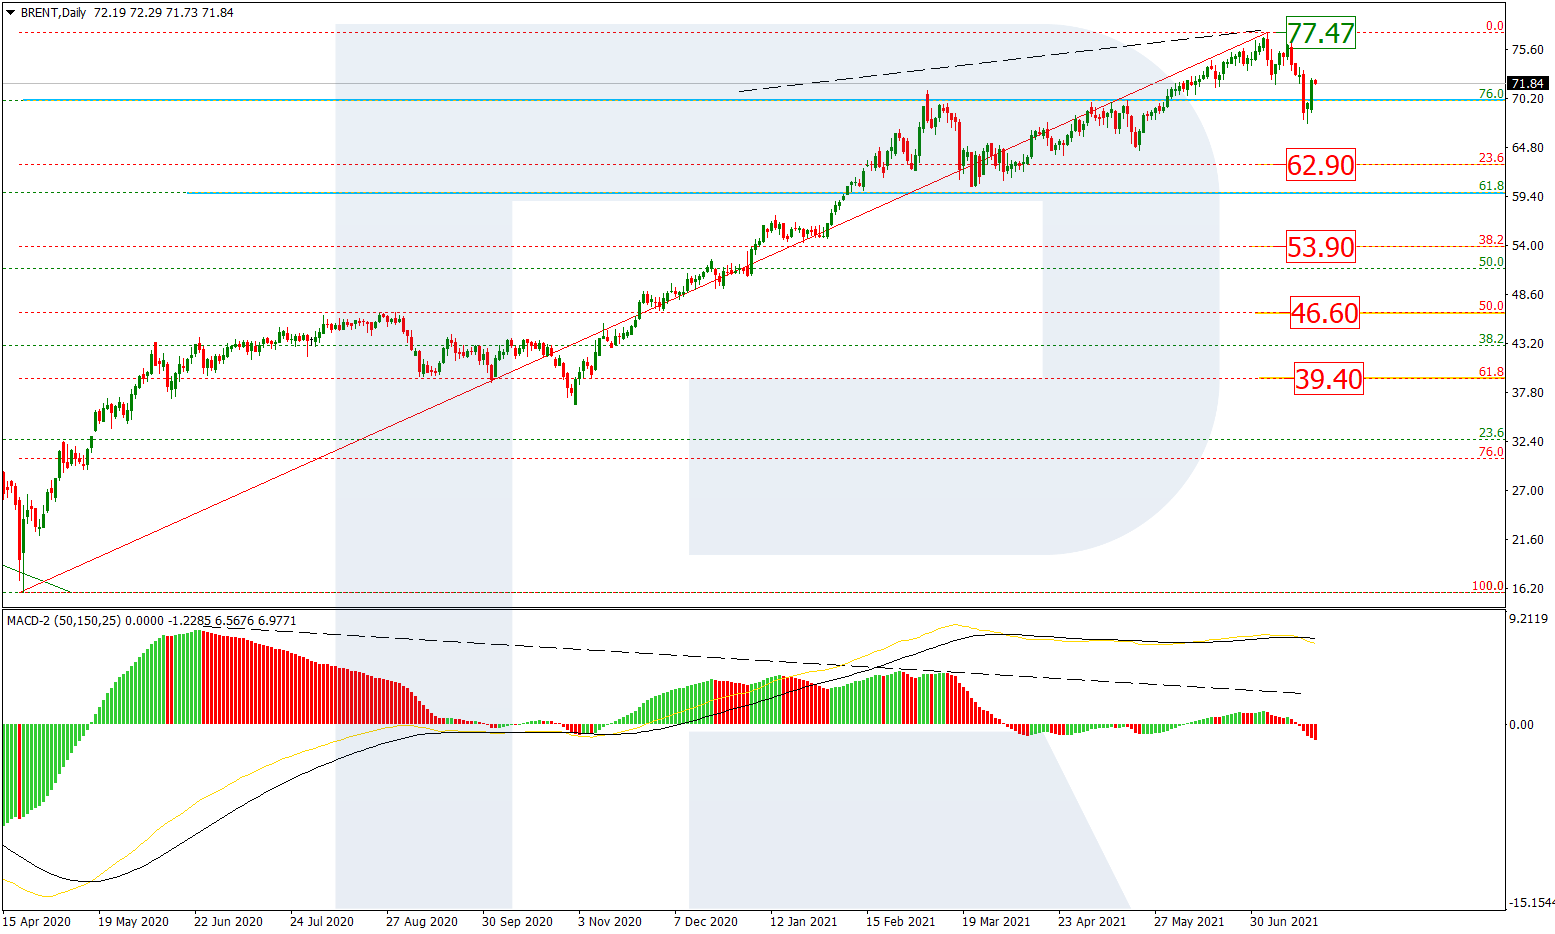
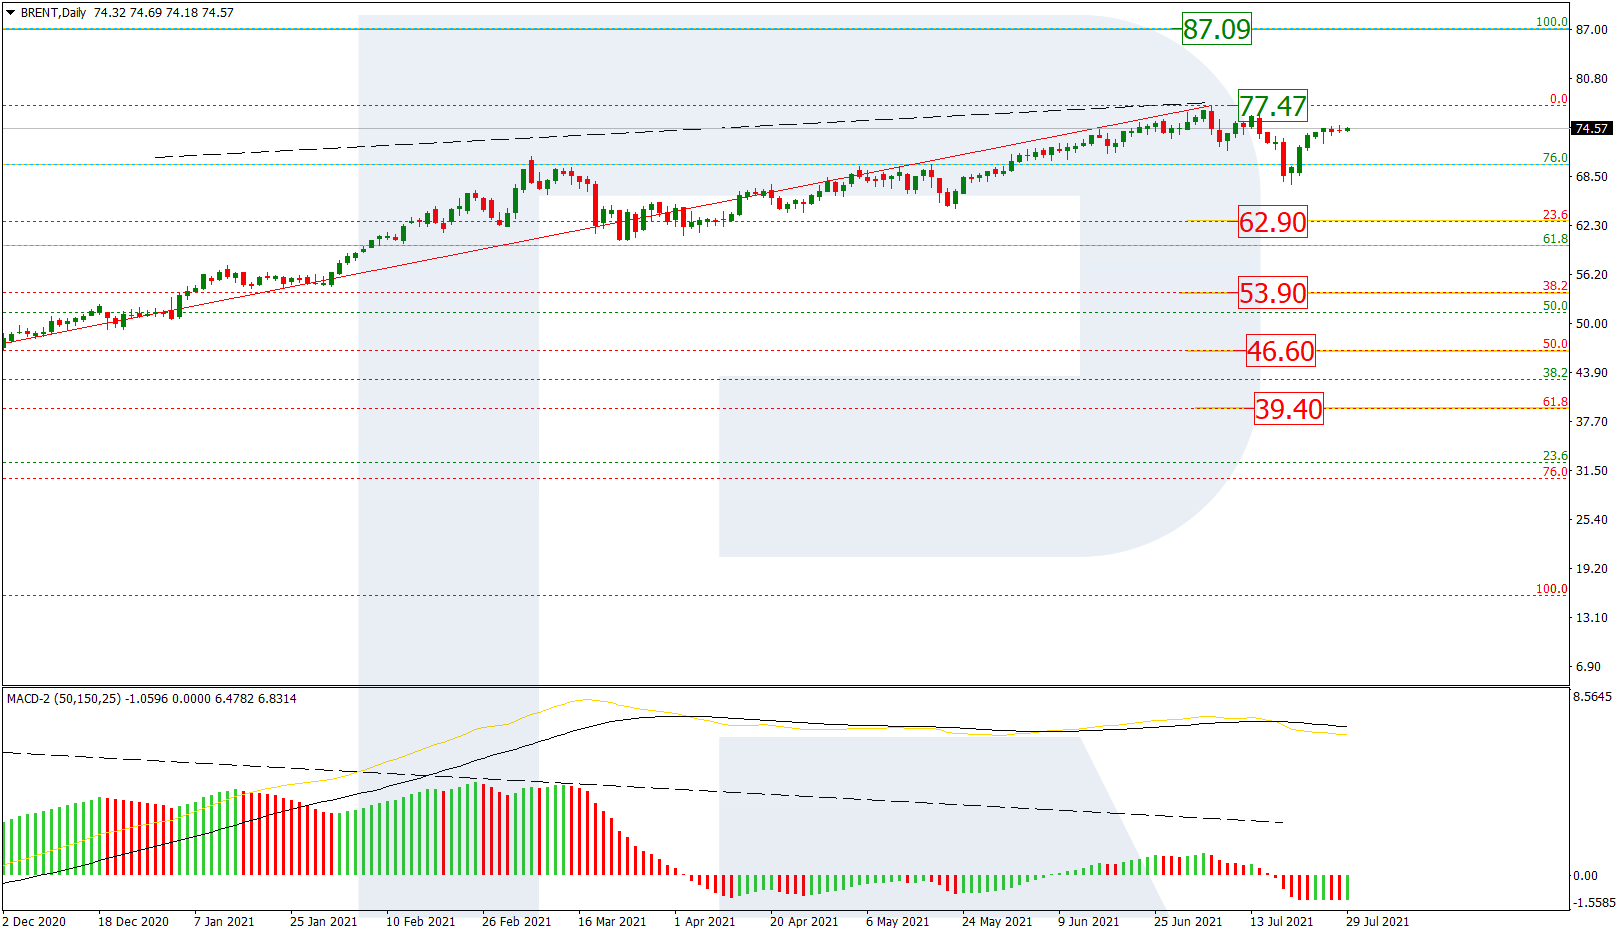
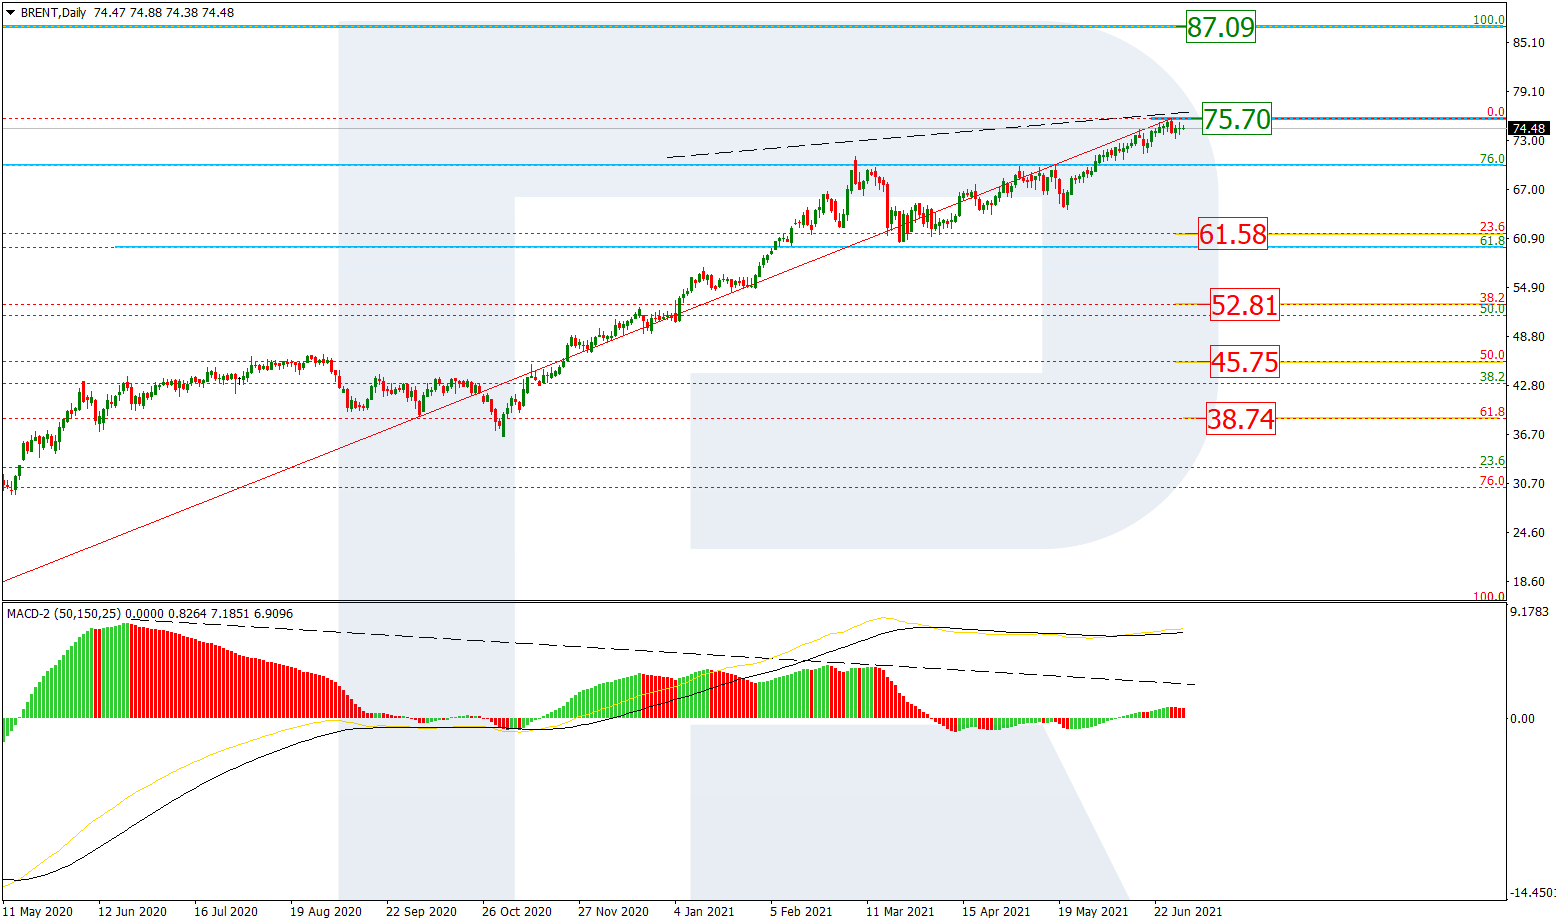
Brent
In the daily chart, after breaking the long-term 76.0% fibo and then reaching 75.70, Brent continues growing towards the long-term high at 87.09. However, a divergence on MACD may indicate a possible pullback or even a reversal.
Read more - Fibonacci Retracements Analysis Brent, Dow Jones