forex software

Create and Test Forex Strategies

forex software

Skip to forum content

Forex Software

Create and Test Forex Strategies

You are not logged in. Please login or register.


(Page 44 of 49)

Forex Software → Market Analysis → Forex Analysis by LiteForex

Pages Previous 1 42 43 44 45 46 49 Next

You must login or register to post a reply

RSS topic feed

Posts: 1,076 to 1,100 of 1,210

Re: Forex Analysis by LiteForex

Current trend

The USD/JPY pair continues to correct downward, trading at 104.30.

The Japanese currency began to actively win back yesterday's losses from the very morning. Service PMI for October, released in the morning, was positive, rising unexpectedly to 47.7 points against the forecast of 46.9 points. Yesterday, the Monetary Policy Committee met to focus on the impact of the pandemic on Japanese growth. According to the committee's forecasts, economic growth by the end of the year will slow down by a value in the range of –5.6% to –5.3%, and in 2021 it will again recover to the levels of 3.0–3.8%.

The US dollar lost its positive momentum. The preliminary election results, which were positive for Donald Trump, threaten to turn into defeat. According to the election headquarters, Joe Biden is already gaining 264 electoral votes, while Trump has only 214. Trump has already begun to actively declare fraud and readiness to sue to review the results in key states, where he first won but then unexpectedly lost.

Support and resistance

The global downtrend continues to form within the downtrend channel, within which another wave of decline is forming. Technical indicators are in a global sale state. Fast EMAs of the Alligator indicator are below the signal one, and the histogram of the AO oscillator is trading deep in the negative zone.

Resistance levels: 104.70, 105.30.
Support levels: 104.15, 103.00.

https://media.clawshorns.com/uploads/files/7778cef666a3a3d474e61a634799c4d7.png

Re: Forex Analysis by LiteForex

Brent Crude Oil: oil is weakening
Current trend

Oil prices began to decline again, dropping to $39.50 per barrel.

EIA data on oil reserves confirmed OPEC's negative scenario. The indicator fell by 7.998 million barrels against the background of the expected increase in reserves by 0.890 million. These data did not have a positive effect on the instrument. On the contrary, investors began to expect with even greater concern the data correction next week. Yesterday, Saudi Aramco said it would cut its December selling prices for Asian buyers. The company decided to take such a step due to a decrease in demand for the company's products under the influence of the second wave of the COVID-19 pandemic.

It is becoming more and more obvious that at the OPEC meeting to be held in mid-November, the main issue will be a new cut in production volumes, which the Russian Federation is actively opposing so far.

Support and resistance

On the local chart, the price moves within the local Expanding formation pattern, within which it approaches the resistance line. Technical indicators are in the state of a sell signal but are starting to slow down. The range of fluctuations of the EMA indicator Alligator begins to narrow, and the histogram of the AO oscillator is approaching the buy zone.

Resistance levels: 41.10, 43.50.
Support levels: 38.90, 35.30.

https://media.clawshorns.com/uploads/files/63c6372151aead1495dc1b307e7ee058.png

Re: Forex Analysis by LiteForex

XAU/USD: wave analysis

The pair may grow.

On the 4-hour chart, the third wave of the higher level (3) develops, within which the wave 5 of (3) forms. Now, the third wave of the lower level iii of 5 is forming, within which the wave (iii) of iii is developing. If the assumption is correct, the pair will grow to the levels of 2013.38–2074.22. In this scenario, critical stop loss level is 1880.51.

https://media.clawshorns.com/uploads/files/ca54cfb4c55c050bdf0a25910e72f879.png
https://media.clawshorns.com/uploads/files/a7d9fcddc0d83a72869f5d3e9a917b9d.png

Re: Forex Analysis by LiteForex

USD/CHF: wave analysis

The pair may grow.

On the 4-hour chart, an upward correction of the higher level forms as the wave (2), within which the development of the wave C of (2) started. Now, the first wave of the lower level i of C is forming. If the assumption is correct, the pair will grow to the levels of 0.9295–0.9398. In this scenario, critical stop loss level is 0.8982.

https://media.clawshorns.com/uploads/files/6b167a53e63b90592e9eaeb9bcf6cab6.png
https://media.clawshorns.com/uploads/files/2009108e40d7c73e25a58240328d05af.png

Re: Forex Analysis by LiteForex

EUR/USD: wave analysis

The correction ended, the pair may grow.

On the daily chart, the first wave of the higher level 1 of (3) develops, within which a local correction ended as the wave iv of 1. Now, the development of the fifth wave v of 1 has started, within which the first entry wave of the lower level (i) of v has formed, and a correction is forming as the wave (ii) of v. If the assumption is correct, after the end of the correction the pair will grow to the levels of 1.2012–1.2200. In this scenario, critical stop loss level is 1.1603.

https://media.clawshorns.com/uploads/files/a19a5a7245fc869af7de1d5cf0ce94bd.png
https://media.clawshorns.com/uploads/files/4ce49e2c7d184c4261ffdc614e56389c.png

Re: Forex Analysis by LiteForex

USD/CAD: wave analysis

The pair may fall.

On the 4-hour chart, a correction of the higher level developed as the wave (2), and the formation of the downward wave (3) started. Now, the first wave of the lower level i of 1 of (3) has formed. If the assumption is correct, after the end of the local correction ii of 1 of (3), the pair will fall to the levels of 1.2800–1.2700. In this scenario, critical stop loss level is 1.3156.

https://media.clawshorns.com/uploads/files/8c0584a5d3594d8d7cf7c286a4380ad1.png
https://media.clawshorns.com/uploads/files/a37012e24c98e01614457fe152fc0e8a.png

Re: Forex Analysis by LiteForex

Current trend

USD declines actively against JPY during today's Asian session, developing a correctional impulse formed the day before. USD is actively testing 105.00 for a breakdown, partially offsetting the active growth of the instrument at the beginning of the week, which was caused by the reports of the successful completion of the Phase III of clinical trials of the Pfizer coronavirus vaccine.

Some support to USD on Thursday was provided by the data on the dynamics of jobless claims. The number of Initial Jobless Claims for the week ending November 6 decreased from 757K to 709K, which turned out to be better than the projected 735K. The number of Continuing Jobless Claims for the period ending October 30 also showed a steady decline from 7.222M to 6.786M with the forecast for a decrease only to 6.9M.

Support and resistance

In the D1 chart, Bollinger Bands are reversing horizontally. The price range is widening from above, maintaining the "bullish" momentum in the short term after the strong growth of the instrument on November 9. MACD is reversing downwards preserving the previous buy signal (located above the signal line). Stochastic is showing similar dynamics, retreating from its highs, indicating the overbought USD in the ultra-short term.

It is worth looking into the possibility of a corrective decline in the short and/or ultra-short term.

Resistance levels: 105.00, 105.33, 105.60, 105.79.

Support levels: 104.75, 104.50, 104.20, 104.00.


https://media.clawshorns.com/uploads/files/935a9c828839c6f0033d595ee748cc61.png
https://media.clawshorns.com/uploads/files/269aed120860188f674a107814c124bc.png

Re: Forex Analysis by LiteForex

EUR/USD: wave analysis

The pair may grow.

On the daily chart, the first wave of the higher level 1 of (3) develops, within which a local correction ended as the wave iv of 1. Now, the development of the fifth wave v of 1 has begun, within which the first entry wave of the lower level (i) of v has formed, and a correction has developed as the wave (ii) of v. If the assumption is correct, the pair will grow within the wave (iii) of v to the levels of 1.2012–1.2200. In this scenario, critical stop loss level is 1.1739.

https://media.clawshorns.com/uploads/files/5b3aa39a25b75d33e4ad0195419c7544.png
https://media.clawshorns.com/uploads/files/4fdf4907df3360edb06912371d101d3a.png

Re: Forex Analysis by LiteForex

XAG/USD: general analysis

Current trend

Silver stays at last week's levels, trading at $24.65 per ounce.

World prices for precious metals are still fairly stable. The amount of investment capital is held without significant changes. According to the latest data from the Commodity Futures Trading Commission (CFTC), over the past week, the number of pure speculative positions in silver increased slightly, reaching 45.8K against 45.3K a week earlier.

The indicators of demand for a commodity asset do not change either. In October, the volume of industrial production of the main importer of metal, China, remained at the September levels and amounted to 6.9%. At the same time, the unemployment rate in October fell to 5.3% from 5.4% in the previous month. The level of foreign direct investment continues to grow and is already at the level of 2019, reaching 6.40%.

Support and resistance

On the global chart of the asset, the price continues to correct downward within the downwards channel. After reaching the resistance line, another wave of decline continues to form. Fast EMAs on the Alligator indicator intertwined with the signal one and the AO oscillator histogram is at the transition level and is ready to enter the negative zone at any moment.

Resistance levels: 25.73, 29.10.
Support levels: 24.00, 21.60.

https://media.clawshorns.com/uploads/files/fed83920368f33b37ee33f502e4149e6.png

Re: Forex Analysis by LiteForex

EUR/USD: the pair is growing

Current trend

The EUR/USD pair is moving within an uptrend, trading around 1.1874.

The long-awaited speech of the head of the ECB Christine Lagarde took place yesterday, and its main topic was the prospects for the recovery of the EU economy. According to the head of the regulator, even in 2021, the economy will not be able to reach pre-quarantine levels. The key task for the bank for this and next year will be to prevent the current economic crisis from escalating into a financial one. Lagarde noted that she expects the average GDP to fall by 8% in 2020 but the introduction of a stricter quarantine is out of the question, as this could lead to an even deeper crisis.

Meanwhile, the US dollar continues to experience significant difficulties. Macroeconomic statistics moved from positive to negative. The underlying retail sales index for October was 0.2%, significantly worse than the 1.2% a month earlier. The volume of retail sales for October fell to 0.3% from 1.6% in September.

Support and resistance

Globally, the correction develops within a wide sideways channel, and the price approaches the resistance line. Technical indicators keep a buy signal. Fast EMAs on the Alligator indicator are above the signal one, and the AO oscillator histogram is kept in the buy zone.

Resistance levels: 1.1930, 1.2080.
Support levels: 1.1780, 1.1610.

https://media.clawshorns.com/uploads/files/a02ca2c788bf9d50c1bec44baa6d484b.png

Re: Forex Analysis by LiteForex

USD/CHF: USD is consolidating

Current trend

USD is trading near zero against CHF during today's Asian session, consolidating near strong support at 0.9100. USD received a short-term impulse to growth, which, however, was more due to technical factors. Macroeconomic statistics from the US published on Wednesday turned out to be rather negative and could hardly have contributed to the development of correctional sentiments in favor of USD. Building Permits Change in October showed zero dynamics after a solid growth of 4.7% in September. Housing Starts Change in October decreased from +6.3% to +4.9%. MBA Mortgage Applications for the week ending November 13 fell by 0.3% after declining by 0.5% in the previous period.

Traders are focused on macroeconomic statistics from the US on the dynamics of jobless claims. Investors expect the indicators to continue declining moderately, but the number of Initial Jobless Claims is unlikely to fall below the psychological level of 700K.

Support and resistance

In the D1 chart, Bollinger Bands are reversing horizontally. The price range is narrowing from above, reflecting the emergence of ambiguous trading dynamics. MACD preserves moderate decline and a weak sell signal (located below the signal line). Stochastic, having approached the level of "20", reversed into a sideways channel, signaling about risks of oversold USD in the ultra-short term.

Resistance levels: 0.9126, 0.9155, 0.9200, 0.9239.
Support levels: 0.9100, 0.9074, 0.9028, 0.9000.

https://media.clawshorns.com/uploads/files/32795e64863da9238b9f17015b7c7e55.png

https://media.clawshorns.com/uploads/files/6e0edfede989d4f31c15ce367fea90fc.png

Re: Forex Analysis by LiteForex

EUR/USD: the pair grows

Current trend

The EUR/USD pair is moving within an upward trend, trading around the level of 1.1890.

The online summit of the EU leaders ended yesterday. The main issues were the settlement of the situation in Nagorno-Karabakh and the vaccine against COVID-19. The leaders agreed to expedite the preparation of national vaccination plans as quickly as possible and expressed their hope that one of the vaccines will soon be available for mass use.

The US dollar is weakening against the major world currencies, trading at 92.220. Investors reacted negatively to the news that US Treasury Secretary Stephen Mnuchin refused to extend some emergency funding programs. In a situation where there are no negotiations on new incentives and the current programs are not extended, investors are leaving the dollar. Another negative factor was the data on Initial Jobless Claims, the number of which increased by 742K instead of the expected 707K.

Support and resistance

Globally, a correction develops within a wide sideways channel, and the price approaches the resistance line. Technical indicators keep a buy signal. Fast EMAs on the Alligator indicator are above the signal one, and the AO oscillator histogram stays in the buy zone. In general, the situation is suitable for a quick reversal and trend change.

Resistance levels: 1.1930, 1.2160.
Support levels: 1.1780, 1.1610.

https://media.clawshorns.com/uploads/files/1fa9c7f173b11603c627d4eac129972a.png

Re: Forex Analysis by LiteForex

EUR/USD: EUR is strengthening

Current trend

EUR is climbing again against USD during today's Asian session, recovering from a slight decline last Friday, which was triggered by the emergence of corrective sentiment in the market. USD positions remain under pressure, as the fundamental picture has changed slightly recently. Investors are concerned about the deteriorating epidemiological situation in the USA, which may eventually lead to additional budget spending and new restrictive measures, which have been diligently avoided by Donald Trump's administration.

However, investors pin their main hopes on the development of a vaccine against coronavirus. Unverified information appears in the media that vaccination of Americans may begin as early as December. Today, traders are focused on the publication of statistics on business activity in the euro area (Germany and France separately) for November. The indices in the manufacturing and services sector are expected to decline, which will be the projected response to restrictive measures in many EU countries.

Support and resistance

Bollinger Bands in D1 chart show moderate growth. The price range is actively narrowing, pointing at the flat nature of trading in the short term. MACD indicator is growing preserving a weak buy signal (located above the signal line). Stochastic, having retreated from the level of "80", reversed into a horizontal plane, indicating fragile balance of power in the ultra-short term.

To open new trading positions, it is necessary to wait for the signals from technical indicators to be clarified.

Resistance levels: 1.1892, 1.1918, 1.1964, 1.2000.
Support levels: 1.1850, 1.1800, 1.1763.

https://media.clawshorns.com/uploads/files/3276770cbaac6dff555b64a95f2ab633.png
https://media.clawshorns.com/uploads/files/ec1ecac65c2246d8ea93cacee4b0e3bc.png

Re: Forex Analysis by LiteForex

EUR/USD

The pair is in a correction and may grow.

On the daily chart, the first wave of the higher level 1 of (3) develops, within which a downward correction ended as the wave iv of 1. Now, the fifth wave v of 1 is developing, within which the first entry wave of the lower level (i) of v has formed, and a local correction is developing as the wave (ii) of v. If the assumption is correct, after the end of the correction, the pair will grow to the levels of 1.2060–1.2200. In this scenario, critical stop loss level is 1.1724.

https://media.clawshorns.com/uploads/files/d9cec0d2e7363883283f7d93595e18bd.png
https://media.clawshorns.com/uploads/files/90dc906ee37f601109fc7b3b95700ecc.png

Re: Forex Analysis by LiteForex

GBP/USD: GBP updates local highs

Current trend

GBP is trading with multidirectional dynamics against USD at today's morning session, consolidating near 1.3350 and local highs since September 2, updated at the beginning of this week. GBP is supported by further weakening of USD against the backdrop of rather optimistic news from the US. Investors are reacting to the long-awaited start of the transfer of power from Donald Trump's administration, which is likely to prevent further aggravation of the political situation in the country. The markets were also encouraged by the reports of the possible appointment of the former Fed Chair Janet Yellen to the post of US Treasury Secretary. Yellen is expected to sharply increase fiscal spending to help lift the US economy out of the crisis caused by the epidemic.

Further growth of GBP is limited by the approaching Brexit deadlines. The Bank of England Governor, Andrew Bailey, warned the markets, saying that the country's exit from the EU without a deal could be "worse than COVID-19".

Support and resistance

Bollinger Bands in D1 chart show stable growth. The price range is expanding from above, having difficulty keeping pace with the development of the "bullish" trend in recent days. MACD indicator is growing preserving an unsteady buy signal (located above the signal line). Stochastic, approaching the level of "80", reversed into a horizontal plane, reacting to risks associated with overbought GBP in the ultra-short term.

Existing long positions should be kept until technical indicators are clarified.

Resistance levels: 1.3400, 1.3481, 1.3550.
Support levels: 1.3311, 1.3250, 1.3200, 1.3125.

https://media.clawshorns.com/uploads/files/2075b1505ee7bd5396368ada3cdfb327.png
https://media.clawshorns.com/uploads/files/315f51e7980f6be9da33ec98a38f31f4.png

Re: Forex Analysis by LiteForex

EUR/USD: EUR updates September highs

Current trend

EUR shows a slight increase against USD today, trading near local highs of early September, updated the day before. EUR is still supported by fairly optimistic market sentiments related to the start of the transfer of power in the USA, as well as the expectation of the imminent start of the coronavirus vaccination campaign. Also yesterday, the market received interesting macroeconomic statistics from the US.

USD was under pressure from the data on the number of Initial Jobless Claims. For the week ending November 20, Initial Jobless Claims again increased from 748K to 778K, while analysts expected it to decrease to 730K. Continuing Jobless Claims for the week ending November 13 decreased from 6.37M to 6.071M, which turned out to be slightly worse than the market forecasts of a decrease to 6.02M.

Today, European investors are focused on the speeches by the ECB representatives, Philip Lane and Isabel Schnabel. Also during the day, the European regulator is to publish the minutes of its last meeting on monetary policy.

Support and resistance

In the D1 chart, Bollinger Bands are reversing horizontally. The price range is expanding but it fails to conform to the development of "bullish" sentiments at the moment. MACD indicator is growing preserving a rather stable buy signal (located above the signal line). Stochastic retains upward direction but is located near its highs, which indicates the overbought EUR in the ultra-short term.

Resistance levels: 1.1930, 1.1964, 1.2000, 1.2030.
Support levels: 1.1892, 1.1850, 1.1800, 1.1763.

https://media.clawshorns.com/uploads/files/347ea3b644015c99dab4e7e542a48124.png
https://media.clawshorns.com/uploads/files/8ec734a65fd1c682f50f803f8b04342f.png

Re: Forex Analysis by LiteForex

GBP/USD: wave analysis

The pair may grow.

On the 4-hour chart, the first wave of the higher level (1) develops, within which the wave 5 of (1) forms. Now, the third wave of the lower level iii of 5 is developing, within which the wave (v) of iii is forming. If the assumption is correct, the pair will grow to the levels of 1.3490–1.3700. In this scenario, critical stop loss level is 1.3267.

https://media.clawshorns.com/uploads/files/69bc186692aeb43c89b3431978044625.png
https://media.clawshorns.com/uploads/files/953cb9b03575ce9da8aa766d9d57c958.png

Re: Forex Analysis by LiteForex

XAU/USD: five-month lows updated

Current trend

Gold prices are showing a steady decline in today's trading, renewing their lows since July 2. The instrument got an opportunity to consolidate below the psychological level of 1800.00, responding to the growing positive sentiment regarding political and economic changes in the USA with the arrival of the Joe Biden administration. Pressure on safe gold is also coming from the growing prospect of tackling COVID-19 through the launch of a massive vaccination campaign, although it will certainly take a long time given the amount of vaccine needed and the rush to develop it.

In turn, some support for gold is provided by the possible prospects for another easing of monetary policy by the world's leading regulators in December, especially from the Fed and the ECB.

Support and resistance

Bollinger Bands in D1 chart demonstrate a stable decrease. The price range is expanding from below; however, it fails to catch the development of "bearish" trend at the moment. MACD is actively going down preserving a stable sell signal (located below the signal line). Stochastic, having reached its lows, reversed into the horizontal plane, indicating growing risks of corrective growth in the short and/or ultra-short term.

To open new positions, it is necessary to wait for the trade signals to become clear. Existing short positions should be kept in the short term.

Resistance levels: 1779.09, 1800.00, 1811.96, 1830.00.
Support levels: 1753.57, 1735.13, 1720.00, 1700.00.

https://media.clawshorns.com/uploads/files/9ff30c336653f879c991e53111b7bfa1.png
https://media.clawshorns.com/uploads/files/ef2d38b0e65d44e16e2c0e52f5b78d50.png

Re: Forex Analysis by LiteForex

XAG/USD: wave analysis

The pair may fall.

On the daily chart, the first wave of the higher level 1 of (3) formed, and a downward correction develops as the wave 2 of (3). Now, the wave a of 2 has formed, the wave b of 2 has developed, and of the wave c of 2 is forming. If the assumption is correct, the price will fall to the levels of 20.52–18.28. In this scenario, critical stop loss level is 25.05.

https://media.clawshorns.com/uploads/files/33fc38ec1bf2d08944b7a08928b7c90a.png
https://media.clawshorns.com/uploads/files/48b7accf8088bce9b5df85c3f9856047.png

Re: Forex Analysis by LiteForex

USD/CAD: USD remains under pressure

Current trend

USD shows multidirectional trading against CAD in today's Asian session, slightly correcting after an active decline the day before, which returned the instrument to the area of local lows since October 2018. USD is under pressure from the worsening epidemiological situation, as well as not the most confident macroeconomic statistics on business activity in the US manufacturing sector. The reduction of the instrument the day before was also facilitated by the speech of the Fed Chair Jerome Powell in the Congress. Powell warned that the country will face several "difficult" months ahead, since it is not yet possible to count on a quick solution to the coronavirus issue, and the economy already needs additional support.

In turn, Canadian data managed to support the market. Canada's annualized GDP in Q3 2020 grew by an impressive 40.5% QoQ after falling by 38.1% QoQ last month. However, the market forecasts assumed that the Canadian economy will grow by 47.6% QoQ. Markit Manufacturing PMI in Canada in November rose from 55.5 to 55.8 points, in line with the forecasts.

Support and resistance

Bollinger Bands in D1 chart demonstrate a moderate decrease. The price range is slightly widening from below but does not conform to the development of the "bearish" trend yet. MACD is going down preserving a moderate sell signal (located below the signal line). Stochastic, on the other hand, maintains a timid uptrend, signaling that USD is oversold in the ultra-short term.

Resistance levels: 1.2950, 1.3000, 1.3050, 1.3100.

Support levels: 1.2900, 1.2850, 1.2800.

https://media.clawshorns.com/uploads/files/0ba63eb653256f2651e2318c395c9ec0.png
https://media.clawshorns.com/uploads/files/92796c8c9d7a5bc25c80835246553da8.png

Re: Forex Analysis by LiteForex

EUR/USD: updating record highs

Current trend

EUR is trading ambiguously against USD during today's Asian session, consolidating near 1.2120 and all-time highs since April 2018. EUR maintains its "bullish" momentum, receiving support from a weak USD; however, technical factors and the coming weekend provoke traders to close some of their long positions. Macroeconomic statistics from Europe published yesterday turned out to be moderately optimistic. Investors were most pleased with data from Germany, which reflected a 2.6% MoM growth in October retail sales after a 2.2% MoM decline in the previous month. Analysts had expected growth of 1.2% MoM. In annual terms, sales added 8.2% YoY, which also turned out to be noticeably better than market forecasts at +5.9% YoY.

Today, investors are focused on business activity statistics in the euro area for November.

Support and resistance

Bollinger Bands in D1 chart show stable growth. The price range is expanding; however, it fails to catch the development of "bullish" trend at the moment. MACD indicator is growing keeping a strong buy signal (located above the signal line). Stochastic retains its upward direction but is located near its highs, which indicates risks of overbought EUR in the ultra-short term.

Technical indicators do not contradict the further development of the uptrend.

Resistance levels: 1.2150, 1.2200, 1.2243.
Support levels: 1.2087, 1.2039, 1.2000, 1.1930.

https://media.clawshorns.com/uploads/files/fb65c97386cf58eaa6a5a1d01969fdc0.png
https://media.clawshorns.com/uploads/files/edd49dcf75e29febc4e2ae5882bcca41.png

Re: Forex Analysis by LiteForex

Brent Crude Oil: wave analysis

The price may grow.

On the daily chart, a downward correction of the higher level developed as the wave B, and the formation of the upward wave C started, within which the first wave 1 of (1) of C develops. Now, the third wave of the lower level iii of 1 is forming, within which the wave (ii) of iii has ended. If the assumption is correct, the price will grow to the levels of 59.92–71.40. In this scenario, critical stop loss level is 46.60.

https://media.clawshorns.com/uploads/files/e2df3fe7d653c228573496bb0799bd75.png
https://media.clawshorns.com/uploads/files/386da41c92e235ab6bb854814afd0800.png

Re: Forex Analysis by LiteForex

Morning Market Review

EUR/USD

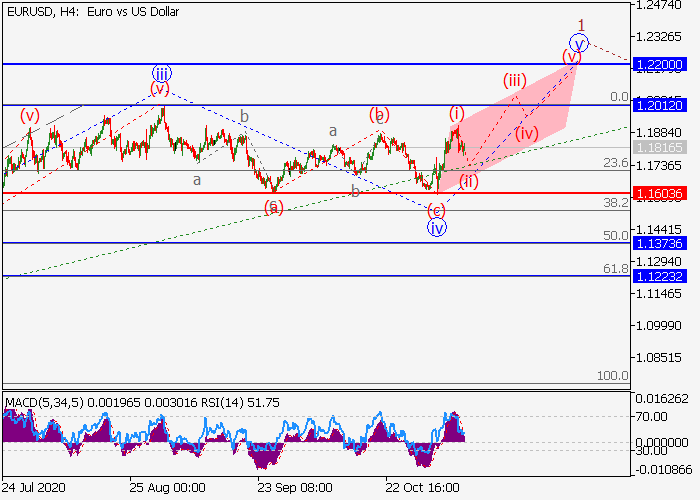
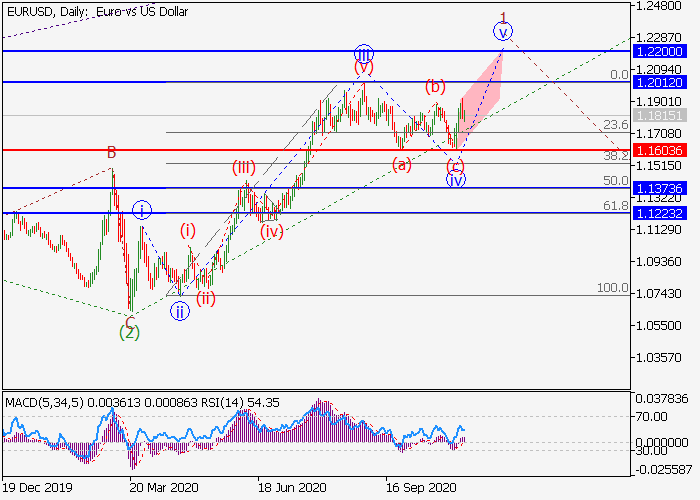
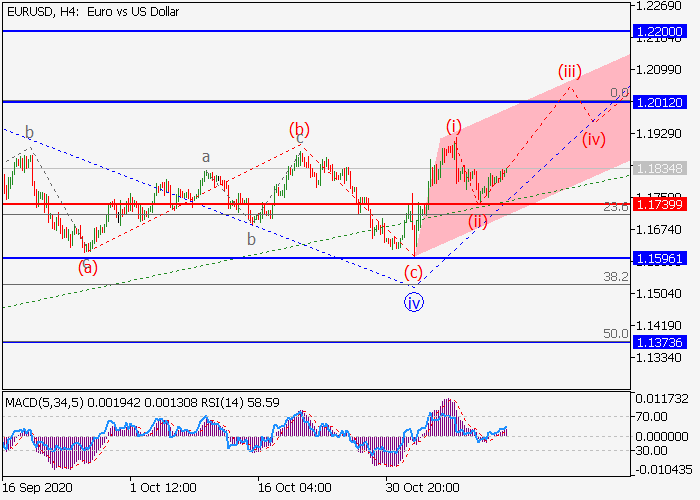
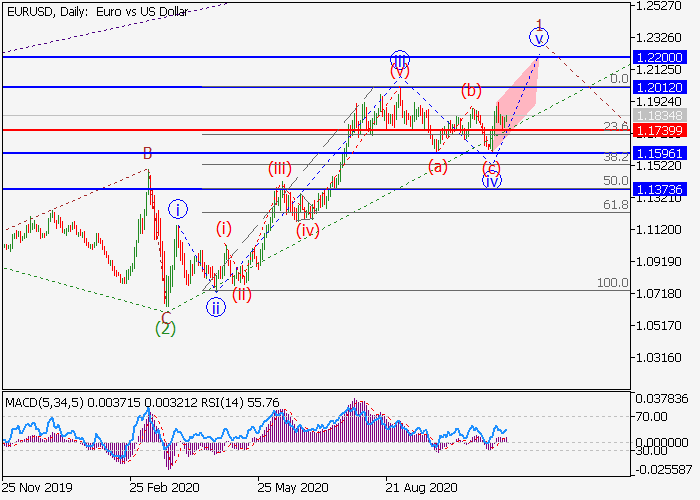
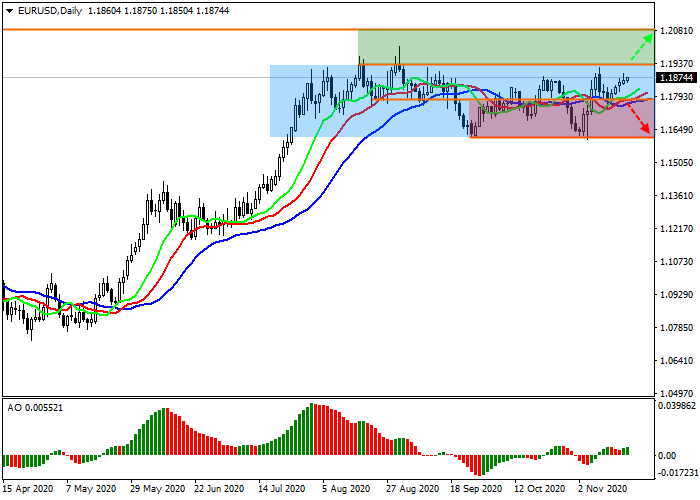
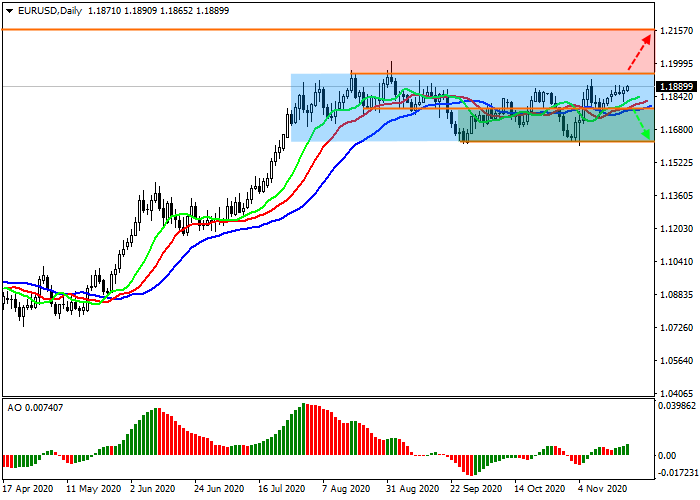
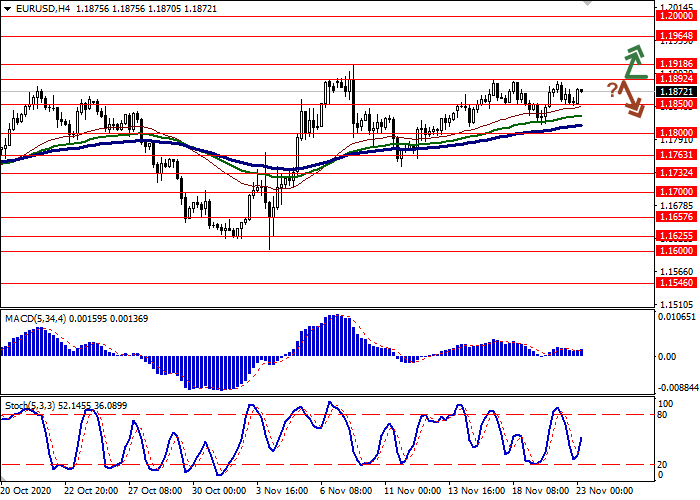
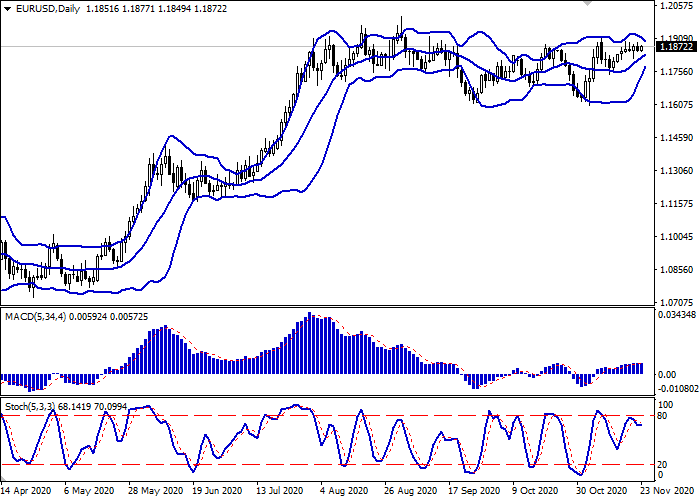
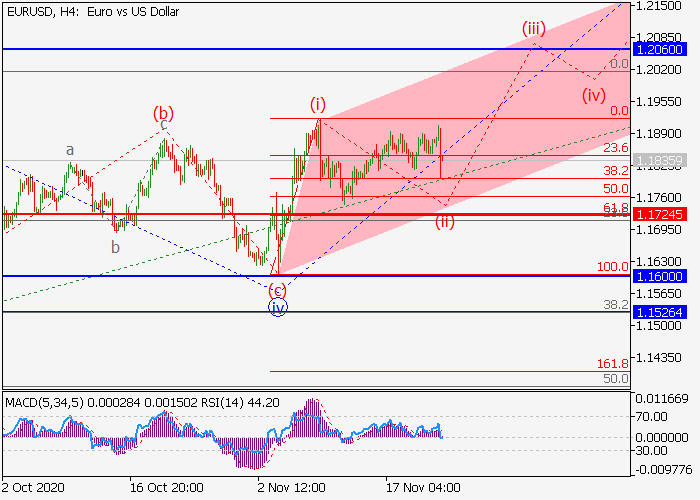
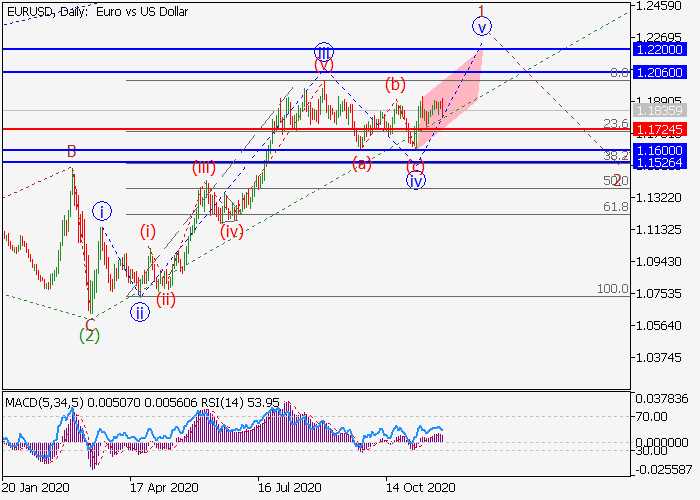
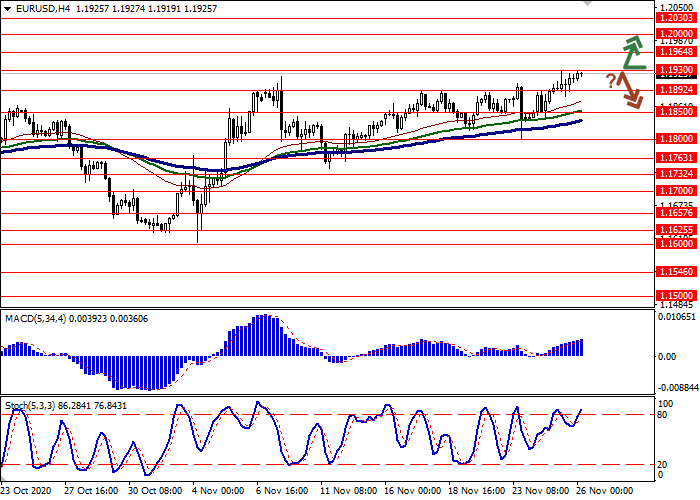
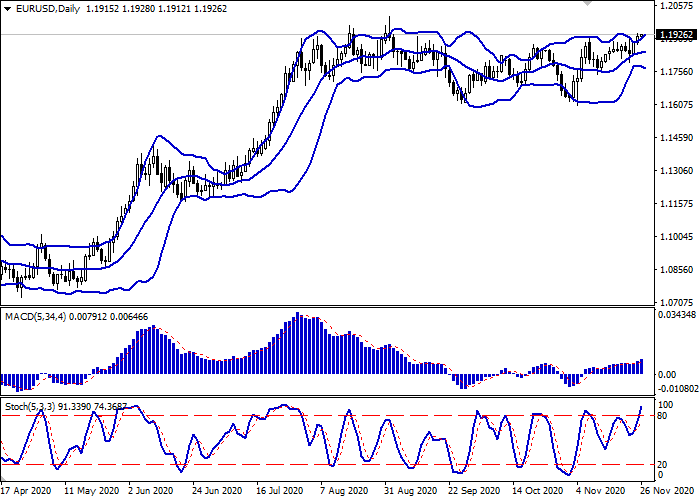
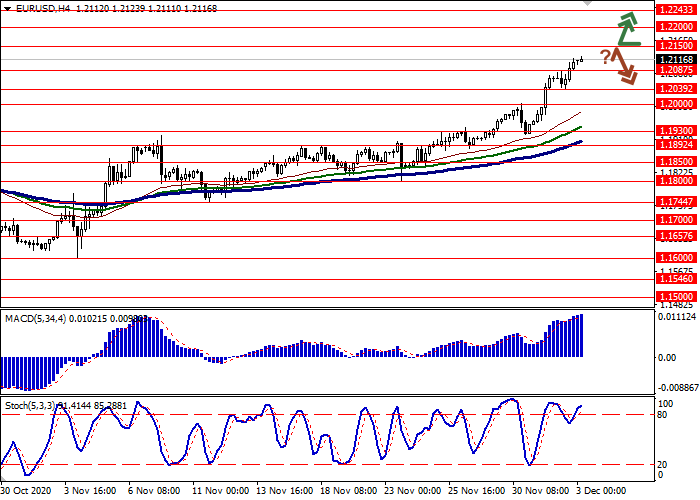
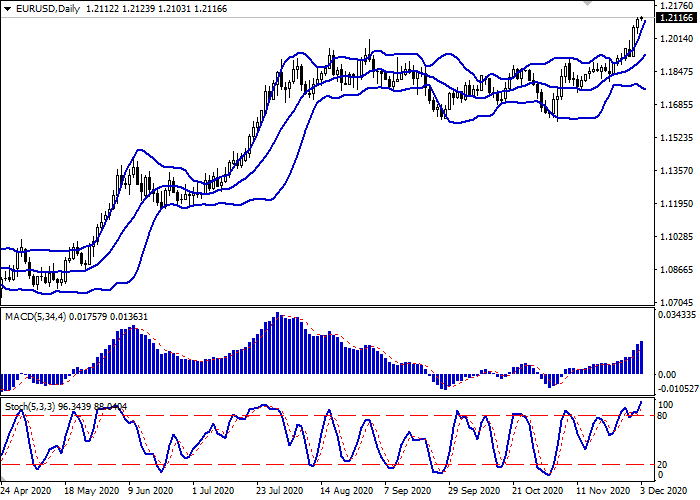
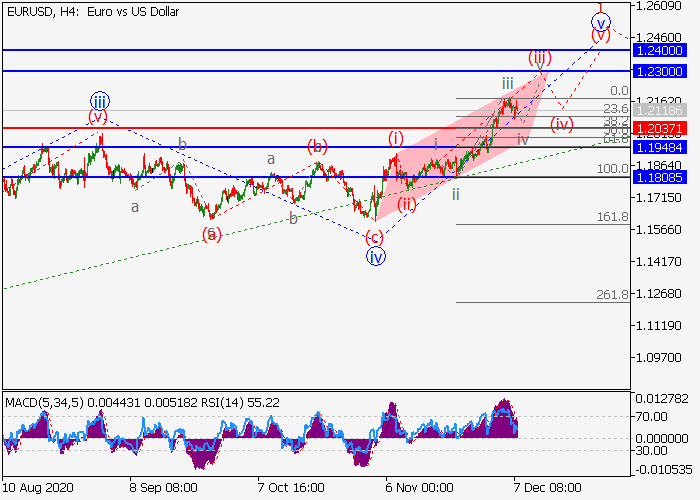
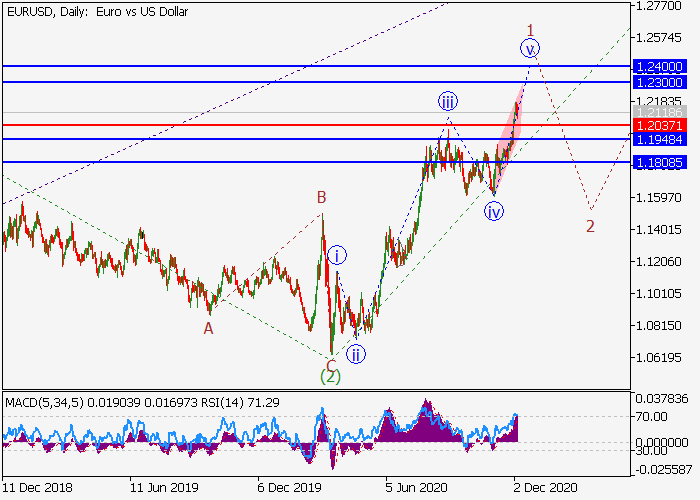
EUR shows flat dynamics of trading against USD during today's Asian session, consolidating after an active decline of the instrument last Friday. EUR ended the session on December 4 in the red, responding to technical factors, while USD remained under pressure after the publication of weak data on employment in the country. The November labor market report reflected an increase in Nonfarm Payrolls by only 245K after an increase of 610K in October. Investors expected a slowdown in the dynamics of the indicator, but hoped for 469K new jobs. At the same time, the Unemployment Rate fell from 6.9% to 6.7%, and Average Hourly Earnings in November increased from +0.1% MoM to +0.3% MoM, which also turned out to be better than the neutral market forecasts. Today, traders expect publication of data on industrial production in Germany for October. Interesting statistics from the US will appear only on Thursday, and before that investors will actively discuss the prospects for further easing of monetary policy from the Fed in the light of the published report on the US labor market.

GBP/USD

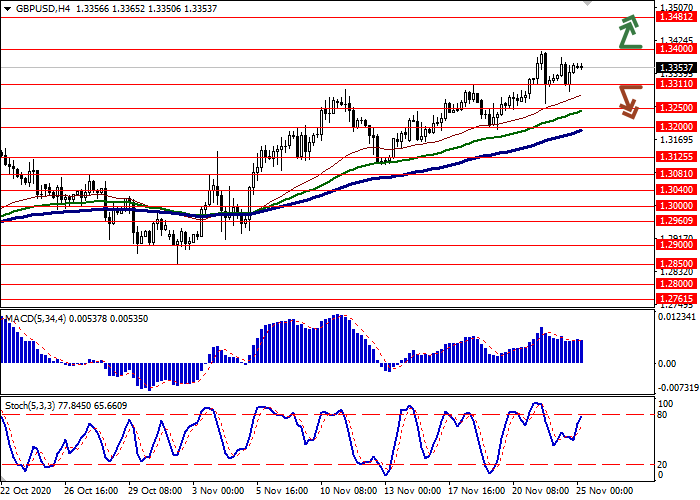
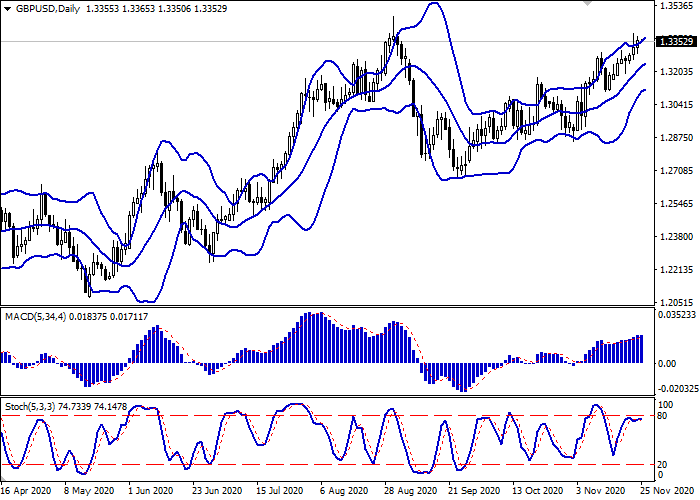
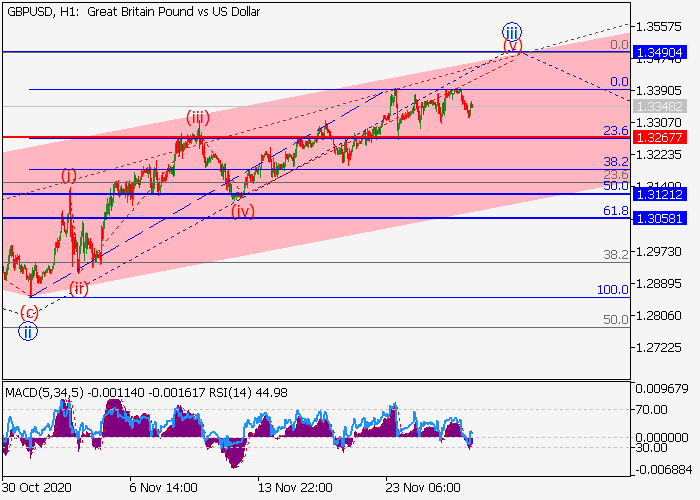
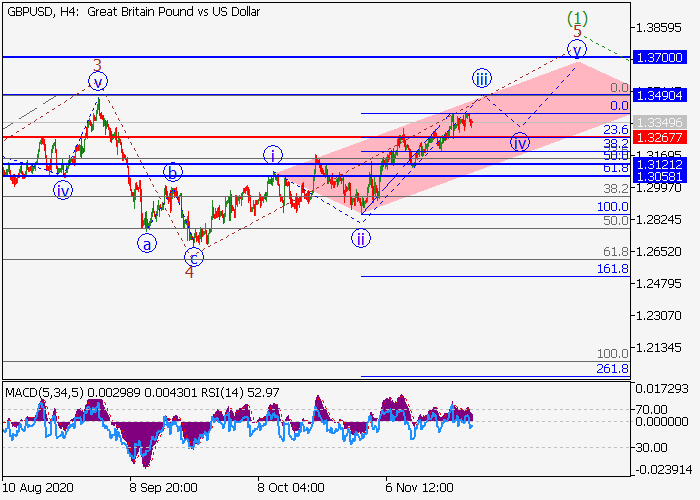
GBP is showing ambiguous trading dynamics against USD in today's Asian session, consolidating near 1.3400. The instrument managed to update record highs since May 2018 last week; however, GBP failed to consolidate at new levels, since the technical factors of the correction were very strong. The trading of the new week starts quite carefully. Some support for GBP is provided by weak data from the US, which appeared at the end of last week, but there are still few fundamental growth factors. It became known on Saturday that the UK and the EU again failed to agree on a trade agreement within the framework of the Brexit transition period, and therefore the negotiators will continue joint meetings this week. Meanwhile, British Prime Minister Boris Johnson and the European Commission President Ursula von der Leyen announced significant progress in the negotiations; however, the market got used to these statements.

NZD/USD

NZD is trading ambiguously against USD in today's Asian session, preparing to test the level of 0.7000 for a breakdown again. The instrument showed an active decline last Friday, retreating from the record highs, updated the day before. The reason for the development of the "bearish" trend were technical factors, while the long-awaited report on the US labor market, released last Friday, disappointed investors with a slowdown in the growth of Nonfarm Payrolls (+245K against +610K in October). The Chinese statistics provide moderate support to the instrument today. China's Exports in November showed an impressive 21.1% YoY growth after rising only by 11.4% YoY in October. Forecasts suggested an increase of 12% YoY only. Imports over the same period, on the contrary, slowed down from +4.7% YoY to +4.5% YoY, which led to a noticeable increase in the trade surplus from USD 58.44B to 75.42B, which is significantly ahead of forecasts investors at USD 53.5B.
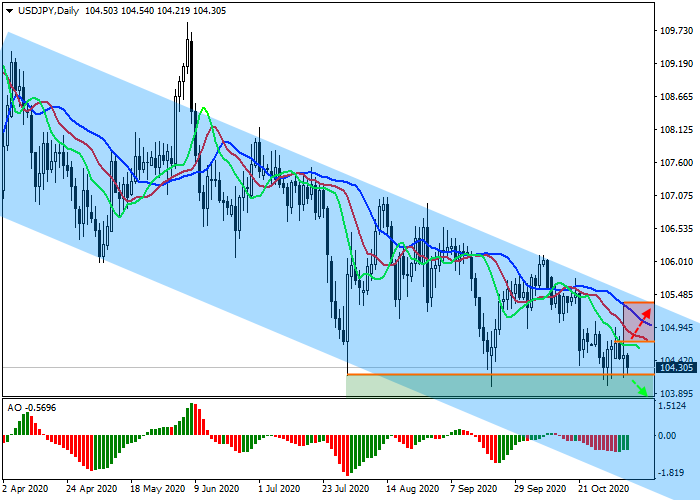
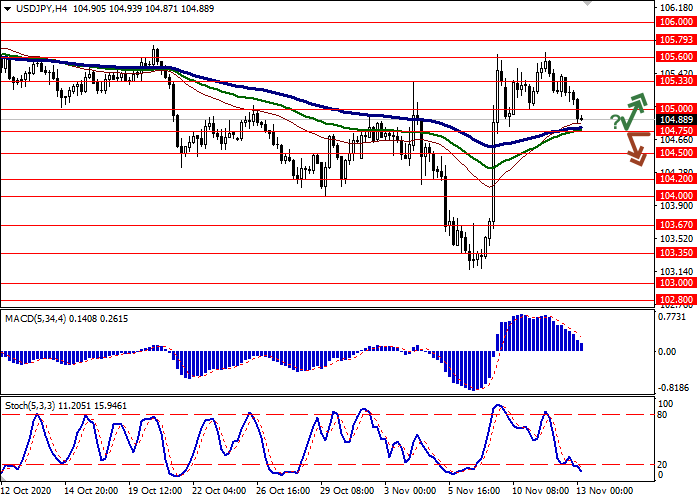
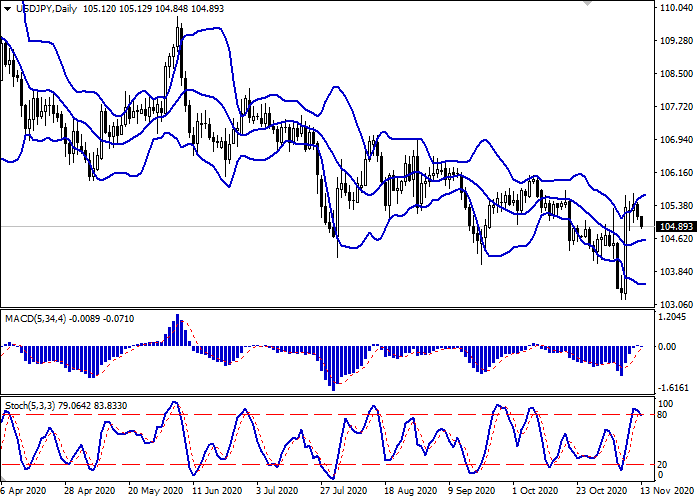
USD/JPY

USD is trading with a downtrend against JPY during today's Asian session, leveling the growth of the instrument last Friday, when the "bulls" still managed to recover, despite the publication of not very successful macroeconomic statistics from the US. At the beginning of the week, investors are returning to strategies that are still characterized by high demand for "safe" assets, given the tense epidemiological situation in the world. Japanese investors expect the publication of statistics from Japan tomorrow. Among other things, traders will be interested in the updated data on the dynamics of Japan's GDP for Q3 2020. In addition, Japan will release the dynamics of changes in Labor Cash Earnings and Household Spending for October.
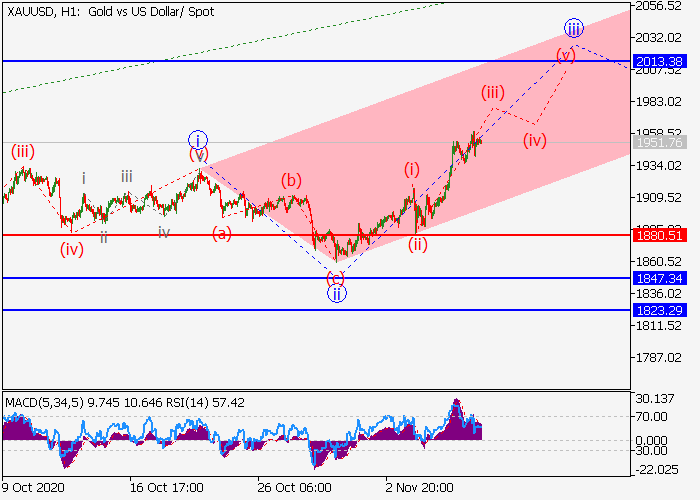
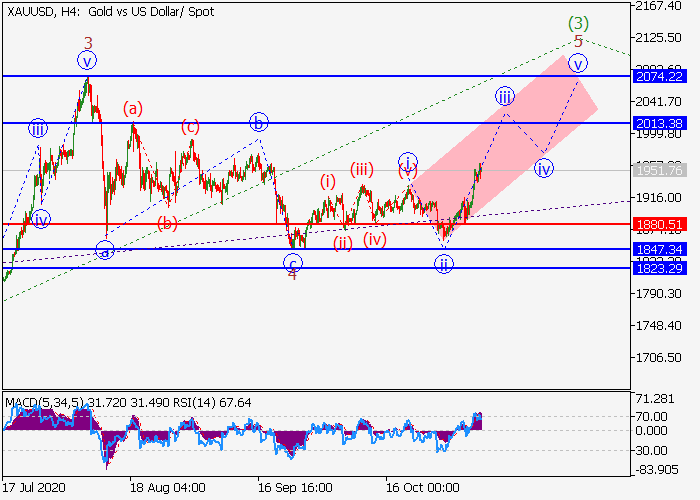
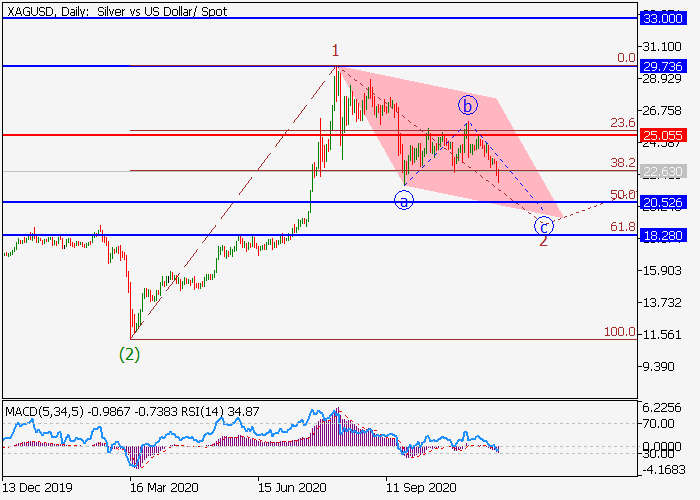
XAU/USD

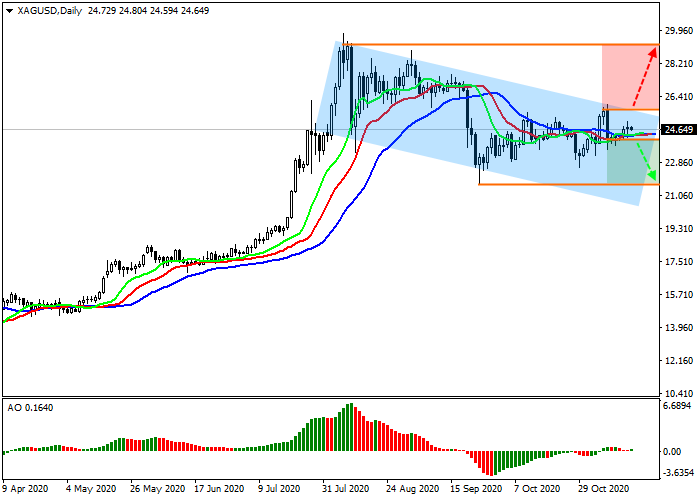
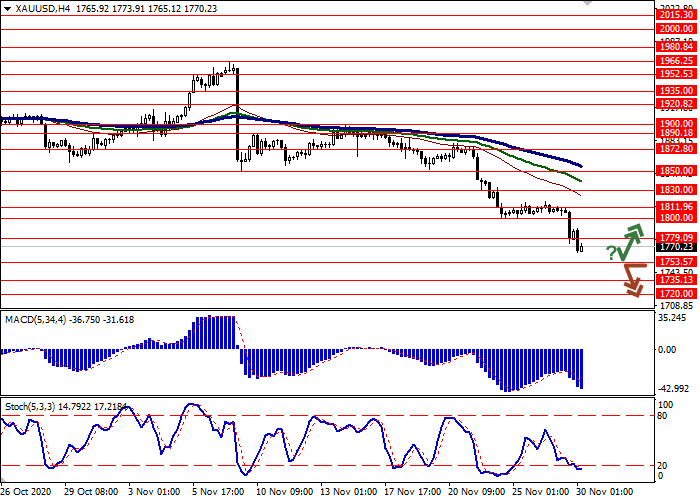
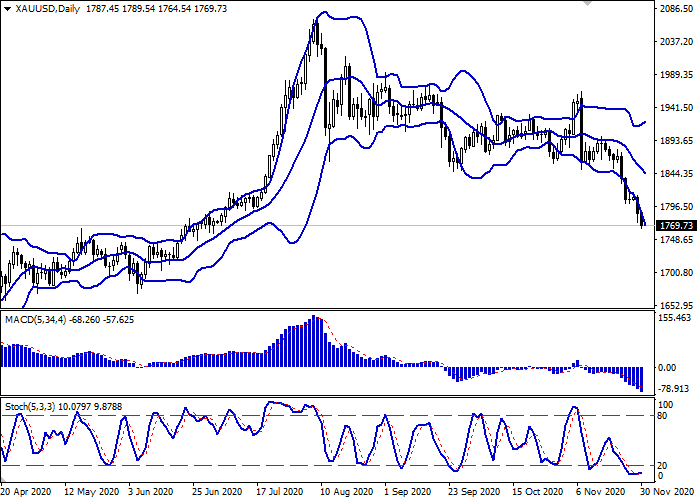
Gold prices are consolidating in today's Asian session, being located near the level of 1840.00 and local highs since November 23, updated at the end of the last trading week. Technical factors contributed to the decline in the instrument last Friday, while fundamentally USD remains under pressure after the publication of an uncertain report on the US labor market for November and in anticipation of new support measures for the American economy. In turn, the optimistic news regarding the development of vaccines against the coronavirus makes traders keep some of the risky positions, and the stock market is kept near record highs. Since December 7, Great Britain is one of the first in the world to begin a large-scale vaccination of the population (starting with risk groups) with a vaccine from Pfizer and BioNTech.

Re: Forex Analysis by LiteForex

EUR/USD: wave analysis

The pair may grow.

On the daily chart, the first wave of the higher level 1 of (3) develops, within which the wave v of 1 forms. Now, the third wave of the lower level (iii) of v is developing, within which the wave iii of (iii) is forming, and the local correction iv of (iii) is ending. If the assumption is correct, the pair will grow to the levels of 1.2300–1.2400. In this scenario, critical stop loss level is 1.2037.

https://media.clawshorns.com/uploads/files/1947064dbb99ece4050bbacbca13c3c3.png
https://media.clawshorns.com/uploads/files/d81b9b392219ff5dd39fe90ca0758060.png

Re: Forex Analysis by LiteForex

USD/CAD: wave analysis

The pair may fall.

On the 4-hour chart, a correction of the higher level developed as the wave (2), and the formation of the downward wave (3) started. Now, the third wave of the lower level iii of 1 is developing, within which the wave (iii) of iii has formed, and the local correction (iv) of iii is developing. If the assumption is correct, after the end of the correction, the pair will fall to the levels of 1.2700–1.2600. In this scenario, critical stop loss level is 1.2906.

https://media.clawshorns.com/uploads/files/6f5cabfd0a4b080dc92ed42ce0d90daf.png
https://media.clawshorns.com/uploads/files/1e8e2dc6530da1a6f0f26101e7b4614a.png

Posts: 1,076 to 1,100 of 1,210

Pages Previous 1 42 43 44 45 46 49 Next

You must login or register to post a reply

Forex Software → Market Analysis → Forex Analysis by LiteForex

Similar topics in this forum