forex software

Create and Test Forex Strategies

forex software

Skip to forum content

Forex Software

Create and Test Forex Strategies

You are not logged in. Please login or register.


(Page 26 of 62)

Forex Software → Market Analysis → InstaForex Analysis

Pages Previous 1 24 25 26 27 28 62 Next

You must login or register to post a reply

RSS topic feed

Posts: 626 to 650 of 1,547

Re: InstaForex Analysis

Forecast for USD/JPY on August 18, 2020

USD/JPY
The Japanese yen sharply accelerated the pace of its strengthening (decline on the chart) after breaking the MACD line on a daily chart. There are about 20 points left to the nearest goal along the 105.45 price channel. The signal line of the Marlin oscillator has entered the negative trend zone, which creates the risk of continuing to pull down the price to the second target of 104.60.

The price has consolidated below the MACD indicator line on the four-hour chart, which also increases the likelihood of overcoming the 105.45 level. But the Marlin oscillator is already entering the oversold zone, which may be a signal for a reversal from the first target level of 105.45.

So: if the price settles below the 105.45 level, we are waiting for the price to fall to the second target of 104.60, consolidating the price above 106.12 will mean restoring growth to 106.70 with a repeated attempt to overcome 107.00.

Analysis are provided byInstaForex.

Best regards, PR Manager / Learn more about InstaForex Company at http://instaforex.com

Re: InstaForex Analysis

Analysis and trading recommendations for the EUR/USD pair on August

Trading recommendations for EUR / USD on August 19 Analysis of transactions Bulls were active at the level of 1.1895 yesterday, as a result of which the quote reached the target level of 1.1933. Such brought profit of about 35 pips within the day.

https://forex-images.ifxdb.com/userfiles/20200819/analytics5f3cbdaaaa361.jpg

This sharp rise in the euro came after US Treasury Secretary Steven Mnuchin said that there was no expected progress in the negotiations between Republicans and Democrats with regards to a new stimulus package.

https://forex-images.ifxdb.com/userfiles/20200819/analytics5f3cbdb3117d0.jpg

Set up buy deals when the quote reaches the price level of 1.1954 (green line on the chart), targeting a rise towards the level of 1.1999. The increase may occur, on the grounds of good inflation data in the eurozone. Take profit at the level of 1.1999. Meanwhile, sell positions after the quote hits a price level of 1.1911 (red line on the chart), aiming a drop to a price of 1.1858. However, such a scenario has a low chance of occurring since aside from inflation data, the latest Fed protocol will also be published today, the contents of which is forecast to put additional pressure on the US dollar. Nonetheless, take profit at the level of 1.1858.

Analysis are provided byInstaForex.

Best regards, PR Manager / Learn more about InstaForex Company at http://instaforex.com

Re: InstaForex Analysis

Forecast for GBP/USD on August 20, 2020

GBP/USD After the British pound gained 135 points on Wednesday and Thursday, this growth was offset by a fall of 140 points. This figure of two extreme candlesticks is called the pattern of rails, a reversal pattern. Also, the Marlin Oscillator formed a divergence with the price.

https://forex-images.ifxdb.com/userfiles/20200820/analytics5f3df1e28cce0.jpg

The closest target for the pound is the 61.8% Fibonacci level at 1.3026, where the British currency has already found support in the period from August 3 to 13. That is, the level is strong enough, and breaking it will send the price to the second target of 1.2912 (76.4% Fibonacci). The main struggle will unfold on the daily MACD line in the 1.2812 area, which is also the price peak from June 10. Overcoming this level reveals the scenario of a medium-term fall of the British currency.

https://forex-images.ifxdb.com/userfiles/20200820/analytics5f3df1e5b6a85.jpg

The price settled below the Fibonacci level of 50.0% on the four-hour chart and below the MACD indicator line, which clears the way for the price to 1.3026.


Analysis are provided byInstaForex.

Best regards, PR Manager / Learn more about InstaForex Company at http://instaforex.com

Re: InstaForex Analysis

Technical Analysis of EUR/USD for August 21, 2020

Technical Market Outlook:
The EUR/USD pair has bounced from the level of 1.1803 which is still a technical support for the price and had retraced 50% of the last wave down already. The momentum is positive and the market is bouncing from the oversold conditions, so another wave up is still on the table befroe the week ends. The next target for bulls is seen at the level of 1.1908 - 1.1915 and the immediate technical support is located at the level of 1.1822, 1.1813, 1.1803 and 1.1790. The larger time frmae trend remains up.

Weekly Pivot Points:
WR3 - 1.2065
WR2 - 1.1962
WR1 - 1.1908
Weekly Pivot - 1.1808
WS1 - 1.1753
WS2 - 1.1661
WS3 - 1.1600

Trading Recommendations:
On the EUR/USD pair the main trend is up, which can be confirmed by 8 weekly up candles on the weekly time frame chart and 3 monthly up candles on the monthly time frame chart. This means any corrections should be used to buy the dips. The key long-term technical support is seen at the level of 1.1445. The key long-term technical resistance is seen at the level of 1.2555.

https://forex-images.ifxdb.com/userfiles/20200821/analytics5f3f5f3ad3e1e.jpg

Analysis are provided byInstaForex.

Best regards, PR Manager / Learn more about InstaForex Company at http://instaforex.com

Re: InstaForex Analysis

Technical Analysis of EUR/USD for August 24, 2020

Technical Market Outlook:
The EUR/USD pair dropped below 61% Fibonacci retracement level again and made a new local low at the level of 1.1754. The market is still in a horizontal trading range, so the bulls still have a chance to bounce higher. The next target for them is seen at the level of 1.1822 and 1.1882. In order to make a new high, the bulls will have to break through the short-term trend line resistance seen at the level of 1.1900. The immediate technical support is located at the level of 1.1720 and 1.1710. The larger time frame trend remains up.

Weekly Pivot Points:
WR3 - 1.2107
WR2 - 1.2031
WR1 - 1.1883
Weekly Pivot - 1.1825
WS1 - 1.1682
WS2 - 1.1616
WS3 - 1.1470

Trading Recommendations:
On the EUR/USD pair the main trend is up, which can be confirmed by 8 weekly up candles on the weekly time frame chart and 3 monthly up candles on the monthly time frame chart. This means any corrections should be used to buy the dips. The key long-term technical support is seen at the level of 1.1445. The key long-term technical resistance is seen at the level of 1.2555.

https://forex-images.ifxdb.com/userfiles/20200824/analytics5f4355b3aa6cf.jpg

Analysis are provided byInstaForex.

Best regards, PR Manager / Learn more about InstaForex Company at http://instaforex.com

Re: InstaForex Analysis

Technical Analysis of ETH/USD for August 25, 2020

Crypto Industry News:

Coinbase and Apple are still not getting along months after Coinbase warned customers it might remove the app from the Apple Store.

Coinbase CEO Brian Armstrong tweeted that Apple continues to block some cryptocurrency features, including the ability to make money and unlimited decentralized applications (dApp) of the browser:

"Apple has been very restrictive and hostile to cryptocurrencies over the years. They still block some features now, including the ability to make money with cryptocurrency through task execution and unlimited Dapp browsers," Armstrong said.

In December, Coinbase warned its customers that it might be necessary to remove the dApp browser from its app to comply with Apple App Store policies. At the time, both Apple and the Google Play Store with Android apps wanted to remove dApps from their network.

Apple, especially its App Store, has been under fire recently due to unfair terms it imposes on app developers and publishers. The Wall Street Journal, The New York Times and game developer Epic Games have called on Apple to find fairer conditions for developers.

Technical Market Outlook:
The ETH/USD pair has hit the target seen at the level of $407.03 - $414.11 with a local top at the level of $409.67 and then was capped. Currently, the price is trading below the level of $400 and the next target for bears is seen at the level of $396.45 (itraday techncial support). The momentum keeps increasing as the market bounces from the oversold conditions as well. All the bigger time frame charts looks very bullish and the up trend should be continued after the correction is completed.

Weekly Pivot Points:
WR3 - $491.79
WR2 - $470.70
WR1 - $424.12
Weekly Pivot - $402.20
WS1 - $357.21
WS2 - $333.72
WS3 - $286.54

Trading Recommendations:
The weekly and monthly time frame trend on the ETH/USD pair remains up and there are no signs of trend reversal, so buy orders are preferred in the mid-term. All the dynamic corrections are still being used to buy the dips. The next mid-term target for bulls is seen at the level of $500. The key mid-term technical support is seen at the level of $364.95.

https://forex-images.ifxdb.com/userfiles/20200825/analytics5f44abd0c2db4.jpg

Analysis are provided byInstaForex.

Best regards, PR Manager / Learn more about InstaForex Company at http://instaforex.com

Re: InstaForex Analysis

Technical Analysis of ETH/USD for August 26, 2020

Crypto Industry News:
The People's Bank of China plans to use its digital currency at the 2022 Winter Olympics in Beijing.

According to a Reuters report, Sun Guofeng, head of the PBoC's monetary policy department, said the bank did not have a schedule to introduce digital currency. However, according to Sun's statement, the PBoC will likely launch it ahead of the 2022 Winter Olympics as they plan to use it at an international sporting event.

The news comes as China is ramping up pilot projects for the digital yuan. Currently, China's central bank is testing its digital currency in Shenzhen, Suzhou, Xiongan and Chengdu. The bank also planned to introduce a digital currency for pilot tests in other regions, including Beijing, Tianjin, Hebei and the Greater Bay area of Hong Kong.

A recent official statement from the bank also noted that the digital yuan was only tested for small retail transactions. Debunking rumors about the impossibility of converting digital currency into banknotes, the central bank also clarified that digital yuan is legal tender that users can convert into banknotes at a 1: 1 ratio.

While there is still too little information on the Chinese digital currency to say anything about its launch and use cases, it is fairly obvious that the bank is making rapid progress towards its introduction.

Technical Market Outlook:
The ETH/USD pair has made another lower low at the level of $369.51, which was in line with 1:1 market geometry target for correction. Currently, the bulls are trying to bounce higher towards the level of $400 in order to reclaim it again, but if they fail, then a new local low should be made. The intraday technical support is seen at the level of $375.62 and the nearest technical resistance is seen at the level of $385.98. All the bigger time frame charts looks very bullish and the up trend should be continued after the correction is completed.

Weekly Pivot Points: WR3 - $491.79
WR2 - $470.70
WR1 - $424.12
Weekly Pivot - $402.20
WS1 - $357.21
WS2 - $333.72
WS3 - $286.54

Trading Recommendations:
The weekly and monthly time frame trend on the ETH/USD pair remains up and there are no signs of trend reversal, so buy orders are preferred in the mid-term. All the dynamic corrections are still being used to buy the dips. The next mid-term target for bulls is seen at the level of $500. The key mid-term technical support is seen at the level of $364.95.

https://forex-images.ifxdb.com/userfiles/20200826/analytics5f45f3d10e0f8.jpg

Analysis are provided byInstaForex.

Best regards, PR Manager / Learn more about InstaForex Company at http://instaforex.com

Re: InstaForex Analysis

Technical Analysis of ETH/USD for August 26, 2020

https://forex-images.ifxdb.com/userfiles/20200826/analytics5f45f3d10e0f8.jpg

Crypto Industry News:
The People's Bank of China plans to use its digital currency at the 2022 Winter Olympics in Beijing.

According to a Reuters report, Sun Guofeng, head of the PBoC's monetary policy department, said the bank did not have a schedule to introduce digital currency. However, according to Sun's statement, the PBoC will likely launch it ahead of the 2022 Winter Olympics as they plan to use it at an international sporting event.

The news comes as China is ramping up pilot projects for the digital yuan. Currently, China's central bank is testing its digital currency in Shenzhen, Suzhou, Xiongan and Chengdu. The bank also planned to introduce a digital currency for pilot tests in other regions, including Beijing, Tianjin, Hebei and the Greater Bay area of Hong Kong.

A recent official statement from the bank also noted that the digital yuan was only tested for small retail transactions. Debunking rumors about the impossibility of converting digital currency into banknotes, the central bank also clarified that digital yuan is legal tender that users can convert into banknotes at a 1: 1 ratio.

While there is still too little information on the Chinese digital currency to say anything about its launch and use cases, it is fairly obvious that the bank is making rapid progress towards its introduction.

Technical Market Outlook:
The ETH/USD pair has made another lower low at the level of $369.51, which was in line with 1:1 market geometry target for correction. Currently, the bulls are trying to bounce higher towards the level of $400 in order to reclaim it again, but if they fail, then a new local low should be made. The intraday technical support is seen at the level of $375.62 and the nearest technical resistance is seen at the level of $385.98. All the bigger time frame charts looks very bullish and the up trend should be continued after the correction is completed.
Weekly Pivot Points:
WR3 - $491.79
WR2 - $470.70
WR1 - $424.12
Weekly Pivot - $402.20
WS1 - $357.21
WS2 - $333.72
WS3 - $286.54

Trading Recommendations: The weekly and monthly time frame trend on the ETH/USD pair remains up and there are no signs of trend reversal, so buy orders are preferred in the mid-term. All the dynamic corrections are still being used to buy the dips. The next mid-term target for bulls is seen at the level of $500. The key mid-term technical support is seen at the level of $364.95.

Analysis are provided byInstaForex.

Best regards, PR Manager / Learn more about InstaForex Company at http://instaforex.com

Re: InstaForex Analysis

Forecast for USD/JPY on August 28, 2020

https://forex-images.ifxdb.com/userfiles/20200828/analytics5f487644ba2be.jpg

USD/JPY
The yen managed to gather strength and reach the nearest target of 106.65 even faster than we expected – we were waiting for the price at this level today, but it hit the level on Thursday. At the moment, the price is already attacking the target level of 107.00. The Marlin oscillator is on a path of optimal growth, price left above balance indicator line (red) that speaks about the growth's strength and, accordingly, we expect the nearest level to be overcome and also a short correction from the second target of 107.35, that is, from the upper borders of consolidation 9-22 July.

https://forex-images.ifxdb.com/userfiles/20200828/analytics5f4876479b01d.jpg

The price settled above both indicator lines on the four-hour chart, the Marlin oscillator is growing, and we are waiting for the price to continue growing to the specified levels.

Analysis are provided byInstaForex.

Best regards, PR Manager / Learn more about InstaForex Company at http://instaforex.com

Re: InstaForex Analysis

Control zones for GBPUSD on 08/31/20

Friday's growth will continue the upward priority pattern. Any reduction in part of Friday's movement will be corrective and will make it possible for you to get the best prices on long deals. The nearest support is WCZ 1/4 1.3248-1.3238. Testing this zone should be considered as an opportunity to buy the British pound.

https://forex-images.ifxdb.com/userfiles/20200831/analytics5f4c7abc1e068.jpg

Growth can continue without forming a deep correction pattern. The nearest target for taking part of the profit is the WCZ 1/2 1.3438-1.3417.

To reverse the upward momentum, it will require absorbing Friday's growth and closing today's trading below Friday's low. The probability of this event is less than 20%, which makes this model unprofitable for termination, and sales go into the background and can not be considered today.

https://forex-images.ifxdb.com/userfiles/20200831/analytics5f4c7abee9f2d.jpg

Daily CZ - daily control zone. The area formed by important data from the futures market, which changes several times a year.
Weekly CZ - weekly control zone. The zone formed by important marks of the futures market, which changes several times a year.
Monthly CZ - monthly control zone. The zone, which is a reflection of the average volatility over the past year.

Analysis are provided byInstaForex.

Best regards, PR Manager / Learn more about InstaForex Company at http://instaforex.com

Re: InstaForex Analysis

Forecast for USD/JPY on September 1, 2020

USD/JPY
USD/JPY gained 54 points on Monday. Having reached the balance line on the daily chart, the price turned down from it. The decline intensified during today's Asian session. It is very likely that our fears about the price falling to support the lower border of the price channel towards the 104.90 level is turning into the main scenario. The signal line of the Marlin oscillator returns to the area of negative values again.

https://forex-images.ifxdb.com/userfiles/20200901/analytics5f4dbbc4b40a7.jpg

The price turned away from the balance line on the four-hour chart, which is very indicative that the trend has not gone upward. Also, Marlin did not try to enter the growth trend zone. We are waiting for the price to decline further, the target is 104.90.

https://forex-images.ifxdb.com/userfiles/20200901/analytics5f4dbbc7a2743.jpg

Analysis are provided byInstaForex.

Best regards, PR Manager / Learn more about InstaForex Company at http://instaforex.com

Re: InstaForex Analysis

Analytics and trading signals for beginners. How to trade the EUR/USD on September 2? Plan for opening and closing trades on Wednesday

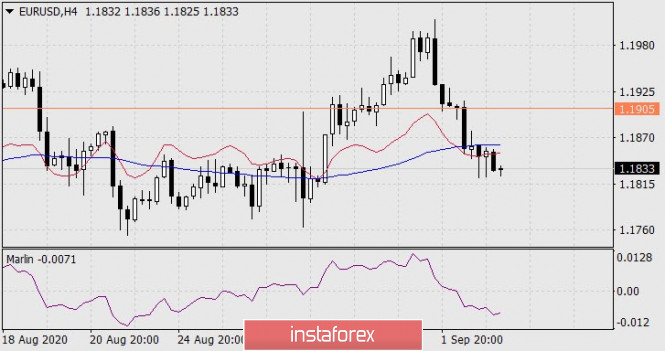
Hourly chart of the EUR/USD pair

https://forex-images.ifxdb.com/userfiles/20200902/analytics5f4f37c358445.jpg

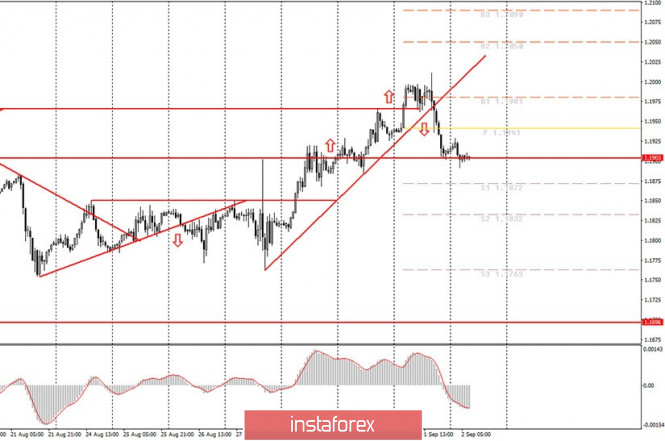
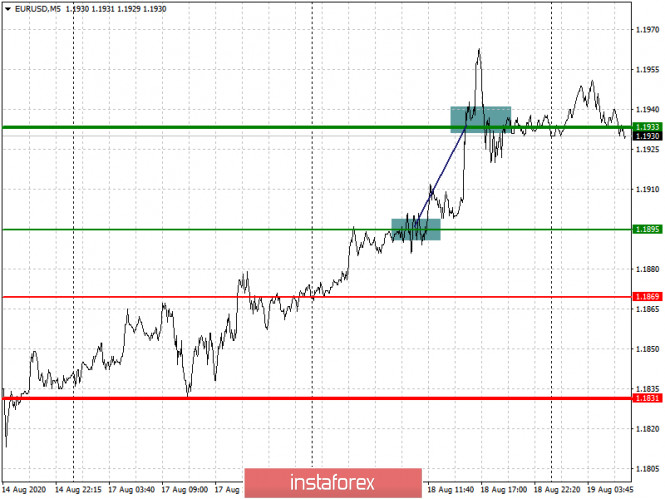
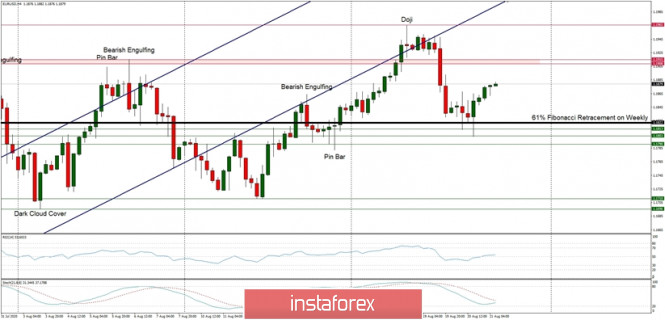
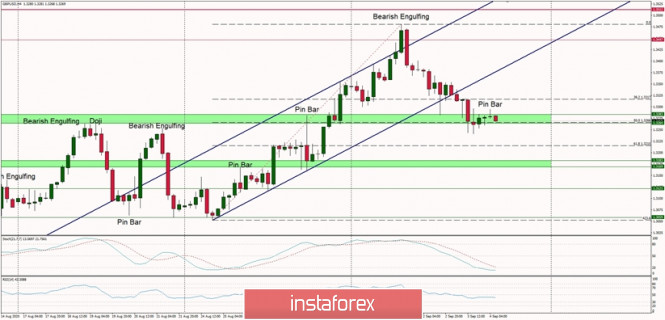
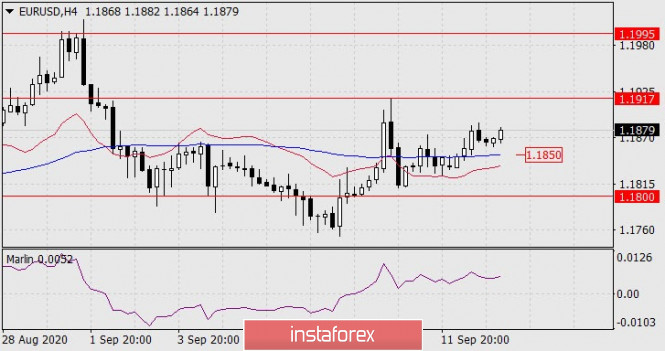
The EUR/USD pair continued to move down last night and reached the 1.1891 level, which we mentioned as a target in yesterday's articles. Today, the pair has new support and resistance levels (updated every day). Therefore, we can draw the following conclusions based on the results of the past 12 hours of trading. First, novice traders can close short positions opened on the signal of overcoming the upward trend line. The profit is about 60 points. Secondly, traders can leave sell positions open until the MACD indicator turns up. Since it is already morning, which means that the European markets will start opening, we can expect a resumption of the trend movement, and it is currently descending. Third, the price also reached the 1.1903 level, which has long been considered as the upper line of the side channel. Thus, we believe that if the 1.1903 level is overcome, then the downward movement can continue on Wednesday, September 2. Novice traders need to decide which option they are going to stick to for today.

Important reports and events from the European Union are not scheduled for September 2. A report on retail sales will be published in Germany, but we do not believe that the market will particularly react to it. Thus, we recommend novice traders to focus on the ADP report on changes in the number of employees in the private sector for August. This report shows how the number of employed Americans has changed in a month. Recall that the last report (for July) was projected with an increase of 1.5 million, but in reality the increase was only 167,000 which is much worse. Today, a growth of 950,000-1,000,000 new workers is projected. Therefore, if this figure is exceeded, then we can expect the US dollar to grow further. Otherwise, the US currency will not receive support from the macroeconomic background. But even so, the euro/dollar pair can still continue to fall (US dollar growth), as technical factors speak in favor of this option. In general, the dollar has not been in demand in the foreign exchange market for several months, but it is still able to show growth for several consecutive days.

Possible scenarios for September 2:

1) Novice traders are not recommended to consider buying the pair at this time, since it has settled below the upward trend line, so the trend has now changed to a downward trend. However, the upward movement may resume in the near future, and the upward trend line may be realigned, changing the inclination of its angle no less. However, at the moment there are no prerequisites for implementing this option. They will appear if the MACD indicator moves up, after which a strong upward movement begins.

2) Sales look more relevant now, but, as mentioned above, the overall low demand for the US dollar and the possible resumption of the upward trend with a realignment of the trendline may result in cancelling the scenario with a new downward trend. In any case, novice traders had a great opportunity to reach the 1.1891 level. Now they can open short positions before the MACD indicator turns up. They can wait for a round of upward correction (if there is one) and, when it is completed, resume trading downward with targets at 1.1872 and 1.1832.

On the chart:
Support and Resistance Levels are the Levels that serve as targets when buying or selling the pair. You can place Take Profit near these levels.

Red lines are the channels or trend lines that display the current trend and show in which direction it is better to trade now.

Up/down arrows show where you should sell or buy after reaching or breaking through particular levels.

The MACD indicator consists of a histogram and a signal line. When they cross, this is a signal to enter the market. It is recommended to use this indicator in combination with trend lines (channels and trend lines).

Important announcements and economic reports that you can always find in the news calendar can seriously influence the trajectory of a currency pair. Therefore, at the time of their release, we recommended trading as carefully as possible or exit the market in order to avoid a sharp price reversal.

Beginners on Forex should remember that not every single trade has to be profitable. The development of a clear strategy and money management are the key to success in trading over a long period of time.

Analysis are provided byInstaForex.

Best regards, PR Manager / Learn more about InstaForex Company at http://instaforex.com

Re: InstaForex Analysis

Forecast for EUR/USD on September 3, 2020

EUR/USD
The euro continues to decline in the uncertainty range of 1.1710-1.1905. The double divergence on the Marlin oscillator is unfolding in full force on the daily chart, the indicator is already in the negative zone, which further increases the technical pressure on the price.

https://forex-images.ifxdb.com/userfiles/20200903/analytics5f5066b652adc.jpg

We are waiting for the price at the lower border of the range, at which the MACD indicator line is already located. Setting the price below it will become a condition for the mid-term fall of the euro.

https://forex-images.ifxdb.com/userfiles/20200903/analytics5f5066b943dd6.jpg

The price settled below the balance (red) and MACD (blue) indicator lines on the four-hour chart. Marlin is in the negative zone. The situation is completely decreasing in this timeframe. The target for the decline is 1.1710.

Analysis are provided byInstaForex.

Best regards, PR Manager / Learn more about InstaForex Company at http://instaforex.com

Re: InstaForex Analysis

Technical Analysis of GBP/USD for September 4, 2020

https://forex-images.ifxdb.com/userfiles/20200904/analytics5f51dec6150f3.jpg

Technical Market Outlook:
The GBP/USD pair has felt out of the parallel channel and made a new local low at the level of 1.3241, slightly below the 50% Fibonacci retracement seen at the level of 1.3266. The next technical support is seen at the level of 1.3215 and 1.3183. This is the immediate support for bulls and a clear violation of this level will be an intraday bearish signal. Weekly and monthly time frame trend remains up, so if the bullish pressure sustain, then the next target for bulls is seen at the level of 1.3447. Please notice, the market conditions are now oversold on the H4 time frame chart, so after a spike down a relief rally might occur.

Weekly Pivot Points:
WR3 - 1.3797
WR2 - 1.3564
WR1 - 1.3482
Weekly Pivot - 1.3256
WS1 - 1.3192
WS2 - 1.2962
WS3 - 1.2882

Trading Recommendations:
On the GBP/USD pair the main, multi-year trend is down, which can be confirmed by the down candles on the monthly time frame chart. Nevertheless, the recent rally form the multi-year lows seen at the level of 1.1404 has been successful and the trend might be reversing. The key long-term technical resistance is seen at the level of 1.3518. Only if one of these levels is clearly violated, the main trend might reverse (1.3518) or accelerate towards the key long-term technical support is seen at the level of 1.1404.

Analysis are provided byInstaForex.

Best regards, PR Manager / Learn more about InstaForex Company at http://instaforex.com

Re: InstaForex Analysis

Technical Analysis of BTC/USD for September 7, 2020

https://forex-images.ifxdb.com/userfiles/20200907/analytics5f55c5fb4ce9a.jpg

Crypto Industry News:
British multinational security company BAE Systems and the Society for Worldwide Interbank Financial Telecommunication, have published a report revealing how cyber criminals launder cryptocurrencies.

Cryptocurrency laundering is still relatively small compared to the massive amounts of money laundered by traditional methods such as bank transfers, according to a Follow the Money study.

But there are a few notable examples and the report delves into the money laundering methods employed by the Lazarus Group, a well-known hacking gang sponsored by the North Korean regime.

Lazarus typically steals cryptocurrencies from an exchange and then starts relaying transactions through various exchanges using what is called a "tiered technique."

Hackers hire East Asian helpers who receive some of the stolen funds to help with their laundry. These facilitators are transferring cryptocurrencies to multiple addresses they own to "obscure the origins of the funds," the study found.

Facilitators transfer some of the funds received via newly added bank accounts that are linked to their stock exchange account - this allows you to convert the cryptocurrency into a fiat currency. Other stolen funds can be transferred in Bitcoin to prepaid gift cards that can be used on other exchanges to purchase additional Bitcoins.

Technical Market Outlook:
The BTC/USD pair has bounced slightly from the level of $9,865 which was the low made during the last wave down from $12,004. The market is hovering around the level of $10,000 again as this is very important psychological level for market participants. The nearest technical resistance is seen at the level of $10,248, $10 343 and $10,430 and the nearest technical support is seen at the level of $9,704. The market conditions are oversold, but the momentum remains weak and negative, so another wave down might be just around the corner.

Weekly Pivot Points:
WR3 - $13,397
WR2 - $12,625
WR1 - $11,243
Weekly Pivot - $10,566
WS1 - $9,071
WS2 - $8,375
WS3 - $6,978
Trading Recommendations:
The weekly trend on the BTC/USD pair remains up and there are no signs of trend reversal, so buy orders are preferred in the mid-term. All the dynamic correction are still being used to buy the dips. The next mid-term target for bulls is seen at the level of $13,712. The key mid-term technical support is seen at the level of $10,463 and $10,000.

Analysis are provided byInstaForex.

Best regards, PR Manager / Learn more about InstaForex Company at http://instaforex.com

Re: InstaForex Analysis

Forecast for AUD/USD on September 8, 2020

AUD/USD
The Australian dollar is on the MACD line on the daily chart. Setting the price below it can trigger a medium-term decline with a movement of about 4.5-5 figures. A condition that can confirm the medium-term decline is when the price leaves the area below the low of 0.7223. The first target will be the August 3 low at 0.7075. Also, in order for the price to confidently settle under the MACD line (0.7277), the aussie needs the signal line of the Marlin oscillator to fall into the zone of negative values.

https://forex-images.ifxdb.com/userfiles/20200908/analytics5f570846bc314.jpg

The situation is also neutral on the 4-hour timeframe. The price is consolidating at the 0.7277 level. The Marlin oscillator moves gently, it can lie in the horizon without entering the growing trend zone. We are waiting for the development of events.

https://forex-images.ifxdb.com/userfiles/20200908/analytics5f570849c5a13.jpg

Analysis are provided byInstaForex.

Best regards, PR Manager / Learn more about InstaForex Company at http://instaforex.com

Re: InstaForex Analysis

Forecast for EUR/USD on September 9, 2020

EUR/USD
The euro fell by 37 points on Tuesday, still hesitating to take decisive action, as is the case with the pound, or at least with the aussie. Investors may still be hoping for positive messages from the European Central Bank on Thursday, but the ECB will not rush to sound an alarm on Brexit, and the negative pressure from the UK is growing every day.

https://forex-images.ifxdb.com/userfiles/20200909/analytics5f58580d2698b.jpg

But on the technical side, the euro quote will have to deal with the support of the MACD line on the daily chart, this is the 1.1750 level. The price falling in the area under it opens the first target at 1.1650. The medium-term prospect for a decline of 1.1315 is support for the embedded price channel line. It is marked in green on the chart. Taking the euro's resilience to the current political turmoil into account, we assume that the price will move from side to side until tomorrow's ECB meeting.

https://forex-images.ifxdb.com/userfiles/20200909/analytics5f5858100f874.jpg

The price is slightly correcting from the key level of 1.1750 on the four-hour chart. The leading Marlin oscillator is in no hurry to decline, which may also play into the euro's hands in its desire to take a closer look at the external situation and clarify the central bank's intentions. The upper limit of the waiting range is determined by the MACD line - the level 1.1855.

Analysis are provided byInstaForex.

Best regards, PR Manager / Learn more about InstaForex Company at http://instaforex.com

Re: InstaForex Analysis

Forecast for EUR/USD on September 10, 2020

EUR/USD
So we are approaching the ECB meeting, and as is almost always the case, from a technical point of view, the euro approached this event in a neutral stance. At the same time, the financial media carefully presented various opinions about the central bank's upcoming assessment of economic prospects. If the ECB really intends to lower the euro (protect the 1.20 level), which is already rumored since the central bank suggested it, then ECB President Christine Lagarde only has verbal tools, up to threats to lower the rate again "if the situation worsens".

https://forex-images.ifxdb.com/userfiles/20200910/analytics5f59ac50eeefa.jpg

The daily chart shows that the price stopped at the MACD line, and the Marlin oscillator is in the lower area. As before, we are waiting for the price to break through, but this may happen after spikes in both directions, since major players are very eager to take positions accumulated before such an intriguing ECB meeting.

https://forex-images.ifxdb.com/userfiles/20200910/analytics5f59ac53d9105.jpg

The four-hour chart shows the price in the 1.1750-1.1855 range indicated earlier. Not strong, but a double convergence on the Marlin oscillator with the signal line entering the zone of positive values indicates a more probable primary price surge. Of course, it is not limited to the 1.1855 level. There is a small accumulation zone in the 1.1925 area.

Analysis are provided byInstaForex.

Best regards, PR Manager / Learn more about InstaForex Company at http://instaforex.com

Re: InstaForex Analysis

Forecast for EUR/USD on September 11, 2020

EUR/USD
Yesterday's ECB meeting, as we expected, did not provide any surprises. The European Central Bank did not shock the public with a desire to control the euro exchange rate, refuse any targets, and only discussed the impact of the euro's current rate on the economy. The changes only affected the ECB's own forecast for GDP for the current year, which improved from -8.7% to -8.0%. There was no strong volatility in the market. The euro jumped by 110 points, but there was no significant reversal; the euro grew by 12 points by the end of the day.

https://forex-images.ifxdb.com/userfiles/20200911/analytics5f5af79399797.jpg

The MACD line has slightly increased on the four-hour chart, now the price needs to settle below the 1.1770 level in order to move towards 1.1650 and lower target levels.

The price reached the second expected volatility level of 1.1920 on the four-hour chart, afterwards it fell and settled under the MACD line. The signal line of the Marlin oscillator is in the zone of positive values, therefore, preparing to fall further will take about two bars, that is, by tonight. Perhaps even longer. The 1.1770 level is strong enough. If there was no such attempt yesterday, the big players are unlikely to attack it today.

So, we expect a sideways trend today, in preparation for an attack on 1.1770 next week.

Analysis are provided byInstaForex.

Best regards, PR Manager / Learn more about InstaForex Company at http://instaforex.com

Re: InstaForex Analysis

Forecast for GBP/USD on September 14, 2020

GBP/USD
The pound sterling was not able to develop a corrective growth last Friday, so it ended the day by falling, but the correction receives a new impetus today in the Asian session, the price went above the 1.2812 level, heading towards the 1.2912 correction target at the 76.4% Fibonacci level. The signal line of the Marlin oscillator is moving up, which is a signal for a correction.

https://forex-images.ifxdb.com/userfiles/20200914/analytics5f5ee93d8f5a0.jpg

The price continues to converge with Marlin on the four-hour chart. We are waiting for the correction to end at the target level of 1.2912, and then a reversal into a new downward trend with targets at 1.2725, 1.2645.

https://forex-images.ifxdb.com/userfiles/20200914/analytics5f5ee940992e0.jpg

Analysis are provided byInstaForex.

Best regards, PR Manager / Learn more about InstaForex Company at http://instaforex.com

Re: InstaForex Analysis

Forecast for EUR/USD on September 15, 2020

The euro, having felt little resistance, grew by 18 points on Monday, following the momentum of the previous days. Meanwhile, British MPs in the second reading passed a law on the internal market last night, contrary to international law (which is what Prime Minister Boris Johnson meant when he spoke of the superiority of British laws). The law is sent to the authorities, and this cannot but put pressure on both the pound and the euro.

https://forex-images.ifxdb.com/userfiles/20200915/analytics5f603839cae05.jpg

The price is above the red balance indicator line on the daily chart, above the MACD line (blue), but the Marlin oscillator signal line touches its own trend line near the border of the growth area. The price could reverse from the current levels. If the price moves under the MACD line, below the 1.1800 level, it will cause the euro to fall towards the first target of 1.1650.

But this has not happened yet, therefore, this plan may not be realized and the price will continue to rise to the upper border of the price channel in the 1.1995 area.

https://forex-images.ifxdb.com/userfiles/20200915/analytics5f60383d52427.jpg

The price settled above the MACD line on the four-hour chart, while Marlin is in the growing trend zone. Breaking through the September 10 high (1.1917) is a signal that the price could rise to 1.1995. But the price did not break far from the MACD line, and the line itself moves horizontally, that is, the prospects for a short-term trend is not very noticeable. The option that the price would move down has a 45% probability. We are waiting for the development of events. Probably, the final choice will take place at the Federal Reserve meeting tomorrow.

Analysis are provided byInstaForex.

Best regards, PR Manager / Learn more about InstaForex Company at http://instaforex.com

Re: InstaForex Analysis

Technical Analysis of EUR/USD for September 16, 2020

https://forex-images.ifxdb.com/userfiles/20200916/analytics5f61abdcbfe63.jpg

Technical Market Outlook:
Another Bearish Engulfing candlestick pattern on H4 time frame has made the market to reverse at the level of 1.1899 and hit the level of 61% Fibonacci retracement located at 1.1822 again. The bulls were unable to break through the retracement located at the level of 1.1912 and the rally was reversed. The bulls are still trying to resume the rally, but the level of 1.1912 has not been violated yet. Any intraday breakout below the level of 1.1813 will accelerate the sell-off towards the level of 1.1753 again, so it is worth to keep an eye on the next developments. The weekly trend remains up,

Weekly Pivot Points:
WR3 - 1.2085
WR2 - 1.1993
WR1 - 1.1923
Weekly Pivot - 1.1829
WS1 - 1.1753
WS2 - 1.1670
WS3 - 1.1589

Trading Recommendations:
On the EUR/USD pair the main trend is up, which can be confirmed by almost 10 weekly up candles on the weekly time frame chart and 4 monthly up candles on the monthly time frame chart. Nevertheless, weekly chart is recently showing some weakness in form of a several Pin Bar candlestick patterns at the recent top. This means any corrections should be used to buy the dips until the key technical support is broken. The key long-term technical support is seen at the level of 1.1445. The key long-term technical resistance is seen at the level of 1.2555.

Analysis are provided byInstaForex.

Best regards, PR Manager / Learn more about InstaForex Company at http://instaforex.com

Re: InstaForex Analysis

Elliott wave analysis of GBP/JPY for September 17, 2020

https://forex-images.ifxdb.com/userfiles/20200917/analytics5f62fa8357c9c.jpg

Technical Market Outlook:
GBP/JPY remains locked inside the sideways consolidation between 135.41 and 136.59 and we will need a break out of this consolidation-area for the next meaningfull move. We prefer a break above resistance at 136.59, but the longer GBP/JPY stays locked inside this sideways consolidation, the risk for a break below support at 135.41 rises for a final spike towards 133.87.

A break above 136.59 will confirm that red wave iv/ has completed and red wave v/ to above 142.72 is in motion.
R3: 137.10
R2: 136.60
R1: 136.06
Pivot: 135.90
S1: 135.75
S2: 135.50
S3: 135.25

Trading recommendation:
We are long GBP from 135.55 and we will move our stop to 135.35

Analysis are provided byInstaForex.

Best regards, PR Manager / Learn more about InstaForex Company at http://instaforex.com

Re: InstaForex Analysis

Forecast for USD/JPY on September 18, 2020

USD/JPY
The USD/JPY pair retested the trend line from below and continued to decline on Thursday. The yen lost 21 points, but today there is a correction in the Asian session. The signal line of the Marlin oscillator is reversing to the upside, which indicates the price's intention to continue doing so until the evening or Monday. After the correction is completed, the price can fall to the previously indicated target of 103.75.

https://forex-images.ifxdb.com/userfiles/20200918/analytics5f64276a0eb99.jpg

The price formed a short convergence with the Marlin oscillator on the four-hour chart, this is a sign of the upcoming sideways price movement. There will probably be no strong movements in the market until the beginning of next week.

https://forex-images.ifxdb.com/userfiles/20200918/analytics5f64276d7c1a5.jpg

Analysis are provided byInstaForex.

Best regards, PR Manager / Learn more about InstaForex Company at http://instaforex.com

Re: InstaForex Analysis

Forecast for AUD/USD on September 21, 2020

AUD/USD
The dollar index strengthened by 0.10% on Friday, it was enough for the overbought Australian to fall by 22 points (-0.30%). The signal line of the Marlin oscillator has sharply turned down and penetrated the zone of negative values, although it is trying to go back up at the moment. We assume this is the effect of price fluctuations. We expect the price to overcome the first target of 0.7249 (September 10 low) and continue to fall to the second target of 0.7110 (August 12 low).

https://forex-images.ifxdb.com/userfiles/20200921/analytics5f6829daad360.jpg

The price fluctuates around the balance and MACD indicator lines on the four-hour chart. On the technical side, this means waiting for another impulse from the external market. The Marlin oscillator turned into a new wave of decline from the border of the growth area, which is a leading sign of a market reversal.

https://forex-images.ifxdb.com/userfiles/20200921/analytics5f6829ddeb158.jpg

We are waiting for the technical signals to be confirmed. This will probably not happen until Tuesday.

Analysis are provided byInstaForex.

Best regards, PR Manager / Learn more about InstaForex Company at http://instaforex.com

Posts: 626 to 650 of 1,547

Pages Previous 1 24 25 26 27 28 62 Next

You must login or register to post a reply

Forex Software → Market Analysis → InstaForex Analysis

Similar topics in this forum