forex software

Create and Test Forex Strategies

forex software

Skip to forum content

Forex Software

Create and Test Forex Strategies

You are not logged in. Please login or register.


(Page 9 of 44)

Forex Software → Market Analysis → Forex Technical Analysis & Forecast by RoboForex

Pages Previous 1 7 8 9 10 11 44 Next

You must login or register to post a reply

RSS topic feed

Posts: 201 to 225 of 1,098

Re: Forex Technical Analysis & Forecast by RoboForex

Ichimoku Cloud Analysis 03.07.2020 (BTCUSD, BRENT, AUDUSD)

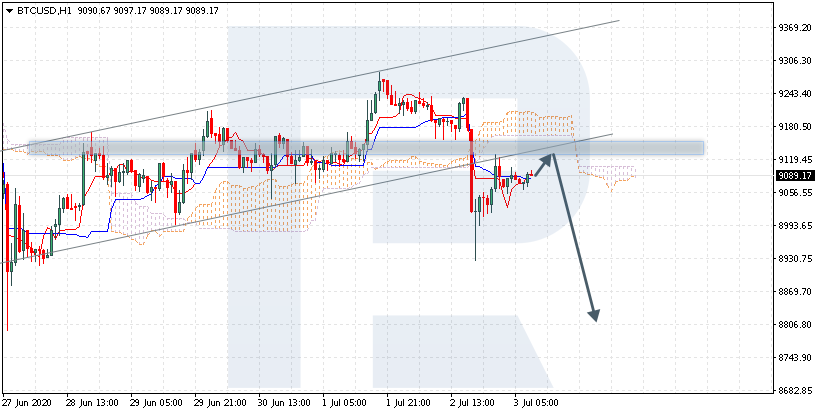
BTCUSD, “Bitcoin vs US Dollar”

BTCUSD is trading at 9089.00; the instrument is moving below Ichimoku Cloud, thus indicating a descending tendency. The markets could indicate that the price may test the cloud’s downside border at 9125.00 and then resume moving downwards to reach 8805.00. Another signal in favor of further downtrend will be a rebound from the rising channel’s downside border. However, the bearish scenario may no longer be valid if the price breaks the cloud’s upside border and fixes above 9295.00. In this case, the pair may continue growing towards 9575.00.

https://roboforex.com/uploads/roboforecast/roboforex.com/99/2020/Ichimoku/july/03/btcusd.png

Read more - Ichimoku Cloud Analysis BTCUSD, BRENT, AUDUSD

Re: Forex Technical Analysis & Forecast by RoboForex

Fibonacci Retracements Analysis 06.07.2020 (GOLD, USDCHF)

GOLD

From the technical point of view, the H4 chart shows that XAUUSD is moving above the broken high at 1764.86. This situation means that the pair has fixed above the high at 1789.05 in order to continue the ascending tendency towards the post-correctional extension area between 138.2% and 161.8% fibo at 1800.60 and 1822.70 respectively. However, a divergence on MACD and low market volatility indicate a possible reversal or pullback. The key support is at 1670.60. The first correctional target may be 23.6% fibo at 1709.30, while the next ones are 38.2%, 50.0%, and 61.8% fibo at 1660.00, 1620.30, and 1580.30 respectively.

https://roboforex.com/uploads/roboforecast/roboforex.com/99/2020/Fibo/july/06/XAUUSDH4.png

Read more - Fibonacci Retracements Analysis GOLD, USDCHF

Re: Forex Technical Analysis & Forecast by RoboForex

Forex Technical Analysis & Forecast 07.07.2020

EURUSD, “Euro vs US Dollar”

After breaking 1.1300, EURUSD is consolidating above it. If later the price breaks this range to the downside, the market may start a new correction towards 1.1250; if to the upside – resume trading inside the uptrend with the short-term target at 1.1380.

https://roboforex.com/uploads/roboforecast/roboforex.com/99/2020/TA/july/07/EURUSDH1.png

Read more - Forex Technical Analysis & Forecast 07.07.2020

Re: Forex Technical Analysis & Forecast by RoboForex

Murrey Math Lines 08.07.2020 (USDJPY, USDCAD)

USDJPY, “US Dollar vs. Japanese Yen”

As we can see in the H4 chart, USDJPY is consolidating between 3/8 and 5/8. In this case, the price is expected to break 3/8 and continue falling towards the support at 1/8. However, this scenario may no longer be valid if the price breaks 4/8 to the upside. After that, the instrument may continue trading upwards to reach the closest resistance at 5/8.

https://roboforex.com/uploads/roboforecast/roboforex.com/99/2020/Murrey/july/08/1.png

Read more - Murrey Math Lines USDJPY, USDCAD

Re: Forex Technical Analysis & Forecast by RoboForex

Japanese Candlesticks Analysis 09.07.2020 (EURUSD, USDJPY, EURGBP)

EURUSD, “Euro vs. US Dollar”

As we can see in the H4 chart, the pair has started forming a new ascending channel. Right now, EURUSD is reversing after forming a Hammer pattern. Considering the current bullish dynamics, the price may finish the correction and then resume trading upwards to reach the resistance level at 1.1420. At the same time, an alternative scenario implies that the instrument may continue falling to return to 1.1330.

https://roboforex.com/uploads/roboforecast/roboforex.com/99/2020/Candles/july/09/EURUSDH4.png

Read more - Japanese Candlesticks Analysis GOLD, NZDUSD

Re: Forex Technical Analysis & Forecast by RoboForex

Ichimoku Cloud Analysis 10.07.2020 (USDCAD, EURGBP, GBPNZD)

USDCAD, “US Dollar vs Canadian Dollar”

USDCAD is trading at 1.3623; the instrument is moving above Ichimoku Cloud, thus indicating an ascending tendency. The markets could indicate that the price may test Tenkan-Sen and Kijun-Sen at 1.3585 and then resume moving upwards to reach 1.3685. Another signal in favor of further uptrend will be a rebound from the descending channel’s upside border. However, the bullish scenario may no longer be valid if the price breaks the cloud’s downside border and fixes below 1.3505. In this case, the pair may continue falling towards 1.3415.

https://roboforex.com/uploads/roboforecast/roboforex.com/99/2020/Ichimoku/july/10/usdcad.png

Read more - Ichimoku Cloud Analysis USDCAD, EURGBP, GBPNZD

Re: Forex Technical Analysis & Forecast by RoboForex

Fibonacci Retracements Analysis 13.07.2020 (GOLD, USDCHF)

XAUUSD, “Gold vs US Dollar”

As we can see in the H4 chart, over the past week, XAUUSD managed to fix above the broken high at 1764.86 and reach 1800.00. From the technical point of view, the chart shows that the pair has already reached the post-correctional extension area between 138.2% and 161.8% fibo at 1800.60 and 1823.00 respectively. After breaking this area, the instrument may try to attack its all-time high at 1920.66. However, a divergence on MACD indicates a possible pullback. The key support is at 1670.60.

https://roboforex.com/uploads/roboforecast/roboforex.com/99/2020/Fibo/july/13/XAUUSDH4.png

Read more - Fibonacci Retracements Analysis GOLD, USDCHF

Re: Forex Technical Analysis & Forecast by RoboForex

Forex Technical Analysis & Forecast 14.07.2020

EURUSD, “Euro vs US Dollar”

EURUSD is still moving upwards to reach 1.1380. Possibly, the pair may reach it and then form a new descending structure towards 1.1314 and then start another growth to reach 1.1350, thus forming a new consolidating range. If later the price breaks this range to the downside, the market may resume trading downwards with the target at 1.1225; if to the upside – form one more ascending structure towards 1.1400.

https://roboforex.com/uploads/roboforecast/roboforex.com/99/2020/TA/july/14/EURUSDH1.png

Read more - Forex Technical Analysis & Forecast 14.07.2020

Re: Forex Technical Analysis & Forecast by RoboForex

Murrey Math Lines 15.07.2020 (USDJPY, USDCAD)

USDJPY, “US Dollar vs. Japanese Yen”

As we can see in the H4 chart, after rebounding from 3/8, USDJPY is expected to resume falling towards the support at 1/8. However, this scenario may no longer be valid if the price breaks 3/8 to the upside. After that, the instrument may continue trading upwards to reach the closest resistance at 5/8.

https://roboforex.com/uploads/roboforecast/roboforex.com/99/2020/Murrey/july/15/1.png

Read more - Murrey Math Lines USDJPY, USDCAD

Re: Forex Technical Analysis & Forecast by RoboForex

Japanese Candlesticks Analysis 16.07.2020 (USDCAD, AUDUSD, USDCHF)

USDCAD, “US Dollar vs Canadian Dollar”

As we can see in the H4 chart, USDCAD is testing the support level once again. By now, the price has formed several reversal patterns, such as Doji. Considering the current downtrend, one may assume that the asset may finish the correction and then continue falling. In this case, the downside target is at 1.3434. Still, an opposite scenario suggests that the instrument may continue growing to return to the resistance area at 1.3685.

https://roboforex.com/uploads/roboforecast/roboforex.com/99/2020/Candles/july/16/USDCADH4.png

Read more - Japanese Candlesticks Analysis USDCAD, AUDUSD, USDCHF

Re: Forex Technical Analysis & Forecast by RoboForex

Ichimoku Cloud Analysis 17.07.2020 (GBPJPY, USDZAR, EURNZD)

GBPJPY, “Great Britain Pound vs Japanese Yen”

GBPJPY is trading at 134.55; the instrument is moving inside Ichimoku Cloud, thus indicating a sideways tendency. The markets could indicate that the price may test the cloud’s downside border at 134.05 and then resume moving upwards to reach 136.55. Another signal is favor of further uptrend will be a rebound from the rising channel’s downside border. However, the bullish scenario may no longer be valid if the price breaks the cloud’s downside border and fixes below 133.85. In this case, the pair may continue falling towards 132.95. To confirm further growth, the asset must break the descending channel’s upside border and fix above 135.35.

https://roboforex.com/uploads/roboforecast/roboforex.com/99/2020/Ichimoku/july/17/gbpjpy.png

Read more - Ichimoku Cloud Analysis GBPJPY, USDZAR, EURNZD

Re: Forex Technical Analysis & Forecast by RoboForex

Fibonacci Retracements Analysis 20.07.2020 (GOLD, USDCHF)

XAUUSD, “Gold vs US Dollar”

As we can see in the H4 chart, XAUUSD is forming a slight local correction inside the post-correctional extension area between 138.2% and 161.8% fibo at 1800.60 and 1823.00 respectively. After breaking this area to the upside, the instrument may try to attack its all-time high at 1920.66. The key support is at 1670.60.

https://roboforex.com/uploads/roboforecast/roboforex.com/99/2020/Fibo/july/18/XAUUSDH4.png

Read more - Fibonacci Retracements Analysis GOLD, USDCHF

213 (edited by RF roboforex 2020-07-21 08:24:38)

Re: Forex Technical Analysis & Forecast by RoboForex

Forex Technical Analysis & Forecast 21.07.2020

EURUSD, “Euro vs US Dollar”

After completing the ascending structure at 1.1469, EURUSD is moving downwards to reach 1.1402. After that, the instrument may grow towards 1.1435, thus forming a new consolidation range between these two levels. If later the price breaks this range to the upside, the market may resume trading upwards to reach 1.1500; if to the downside – start a new decline with the target at 1.1333.

https://roboforex.com/uploads/roboforecast/roboforex.com/99/2020/TA/july/21/EURUSDH1.png

Read more - Forex Technical Analysis & Forecast 21.07.2020

214 (edited by RF roboforex 2020-07-22 08:52:56)

Re: Forex Technical Analysis & Forecast by RoboForex

Murrey Math Lines 22.07.2020 (USDJPY, USDCAD)

USDJPY, “US Dollar vs. Japanese Yen”

In the H4 chart, USDJPY is moving below the consolidation range not far from 1/8. In this case, the price is expected to break this level and then continue falling towards the support at 0/8. However, this scenario may no longer be valid if the price breaks 2/8 to the upside. After that, the instrument may continue trading upwards to reach the closest resistance at 3/8.

https://roboforex.com/uploads/roboforecast/roboforex.com/99/2020/Murrey/july/22/1.png

Read more - Murrey Math Lines USDJPY, USDCAD

Re: Forex Technical Analysis & Forecast by RoboForex

Japanese Candlesticks Analysis 23.07.2020 (GOLD, NZDUSD, GBPUSD)

XAUUSD, “Gold vs US Dollar”

As we can see in the H4 chart, the uptrend continues. After finishing a Shooting Star pattern not far from the resistance level, XAUUSD has failed to reverse and right now is still moving upwards. In this case, the upside target may be at 1890.00. At the same time, an alternative scenario implies that the pair may correct towards 1850.00 after updating the highs.

https://roboforex.com/uploads/roboforecast/roboforex.com/99/2020/Candles/july/23/XAUUSDH4.png

Read more - Japanese Candlesticks Analysis GOLD, NZDUSD, GBPUSD

Re: Forex Technical Analysis & Forecast by RoboForex

Forex Technical Analysis & Forecast 24.07.2020

EURUSD, “Euro vs US Dollar”

EURUSD is consolidating around 1.1580; it has already expanded the range up to 1.1625. Possibly, today the pair may fall to test 1.1580 from above and then form one more ascending structure to complete this wave at 1.1654. Later, the market may correct with the target at 1.1400.

https://roboforex.com/uploads/roboforecast/roboforex.com/99/2020/TA/july/24/EURUSDH1.png

Read more - Forex Technical Analysis & Forecast 24.07.2020

Re: Forex Technical Analysis & Forecast by RoboForex

Fibonacci Retracements Analysis 27.07.2020 (GOLD, USDCHF)

XAUUSD, “Gold vs US Dollar”

As we can see in the daily chart, XAUUSD has updated its all-time high. Later, the instrument may continue growing towards the post-correctional extension area between 138.2% and 161.8% fibo at 2254.60 and 2460.00 respectively. In the nearest future, the asset may start a short-term correction to the downside.

https://roboforex.com/uploads/roboforecast/roboforex.com/99/2020/Fibo/july/27/XAUUSDDaily.png

Read more - Fibonacci Retracements Analysis GOLD, USDCHF

Re: Forex Technical Analysis & Forecast by RoboForex

Forex Technical Analysis & Forecast 28.07.2020

EURUSD, “Euro vs US Dollar”

After forming the ascending wave at 1.1780, EURUSD is correcting. Possibly, the pair may fall to reach 1.1678 and then form one more ascending structure with the target at 1.1816. Later, the market may resume trading downwards as a correction towards 1.1580.

https://roboforex.com/uploads/roboforecast/roboforex.com/99/2020/TA/july/28/EURUSDH1.png

Read more - Forex Technical Analysis & Forecast 28.07.2020

Re: Forex Technical Analysis & Forecast by RoboForex

Murrey Math Lines 29.07.2020 (USDJPY, USDCAD)

USDJPY, “US Dollar vs. Japanese Yen”

As we can see in the H4 chart, USDJPY is moving inside the “oversold area”. In this case, the price is expected to break -1/8 and then continue growing towards the resistance at 0/8. However, this scenario may no longer be valid if the price breaks -2/8 to the downside. After that, the lines at the chart will be redrawn, thus helping to define new downside targets.

https://roboforex.com/uploads/roboforecast/roboforex.com/99/2020/Murrey/july/29/1.png

Read more - Murrey Math Lines 29.07.2020 (USDJPY, USDCAD)

Re: Forex Technical Analysis & Forecast by RoboForex

Japanese Candlesticks Analysis 30.07.2020 (EURUSD, USDJPY, EURGBP)

EURUSD, “Euro vs. US Dollar”

As we can see in the H4 chart, the asset is correcting within the ascending tendency. After forming a Harami pattern not far from the resistance level, EURUSD has started reversing. Considering the current bullish dynamics, the price may form a slight pullback towards the rising channel’s upside border and then resume trading upwards to reach the next resistance level at 1.1845. At the same time, an alternative scenario implies that the instrument may continue falling to return to 1.1645.

https://roboforex.com/uploads/roboforecast/roboforex.com/99/2020/Candles/july/30/EURUSDH4.png

Read more - Japanese Candlesticks Analysis EURUSD, USDJPY, EURGBP

Re: Forex Technical Analysis & Forecast by RoboForex

Forex Technical Analysis & Forecast 31.07.2020

EURUSD, “Euro vs US Dollar”

After breaking 1.1800 to the upside and then reaching 1.1900, EURUSD is still trading upwards. Possibly, the pair may correct a little bit to reach 1.1861 and then form one more ascending structure towards 1.1950 or even 1.2000. However, if the price breaks the ascending channel to the downside, the market may start a more significant correction with the target at 1.1750.

https://roboforex.com/uploads/roboforecast/roboforex.com/99/2020/TA/july/31/EURUSDH1.png

Read more - Forex Technical Analysis & Forecast 31.07.2020

Re: Forex Technical Analysis & Forecast by RoboForex

Fibonacci Retracements Analysis 03.08.2020 (GOLD, USDCHF)
XAUUSD, “Gold vs US Dollar”

As we can see in the H4 chart, MACD is forming a divergence, which may indicate a possible correction to the downside with the targets at 23.6%, 38.2%, and 50.0% fibo at 1915.25, 1868.20, and 1830.20 respectively. The resistance is the high at 1990.68. The next upside targets are inside the post-correctional extension area between 138.2% and 161.8% fibo at 2254.60 and 2460.00 respectively.

https://roboforex.com/uploads/roboforecast/roboforex.com/99/2020/Fibo/august/03/XAUUSDH4.png

Read more - Fibonacci Retracements Analysis GOLD, USDCHF

Re: Forex Technical Analysis & Forecast by RoboForex

Forex Technical Analysis & Forecast 04.08.2020

EURUSD, “Euro vs US Dollar”

After finishing the descending impulse at 1.1700, EURUSD is correcting towards 1.1800. After that, the instrument may form a new descending structure to break 1.1700 and then continue trading downwards with the short-term target at 1.1588.

https://roboforex.com/uploads/roboforecast/roboforex.com/99/2020/TA/august/04/EURUSDH1.png

Read more - Forex Technical Analysis & Forecast 04.08.2020

Re: Forex Technical Analysis & Forecast by RoboForex

Murrey Math Lines 05.08.2020 (USDJPY, USDCAD)

USDJPY, “US Dollar vs. Japanese Yen”

As we can see in the H4 chart, USDJPY is consolidating nor far from 3/8. In this case, the price is expected to rebound from this level and then resume growing towards the resistance at 5/8. However, this scenario may no longer be valid if the price breaks 3/8 to the downside. After that, the instrument may continue falling to reach the closest support at 2/8.

https://roboforex.com/uploads/roboforecast/roboforex.com/99/2020/Murrey/august/05/1.png

Read more - Murrey Math Lines USDJPY, USDCAD

Re: Forex Technical Analysis & Forecast by RoboForex

Fibonacci Retracements Analysis 06.08.2020 (AUDUSD, USDCAD)

AUDUSD, “Australian Dollar vs US Dollar”

In the H4 chart, after breaking the high at 0.7064 and then reaching the long-term 61.8% fibo, AUDUSD continues testing the area around it. The next upside target may be 76.0% fibo at 0.7503. At the same time, the MACD indicator is forming a divergence, which may hint at a possible correction to the downside soon. The closest correctional target may be 50.0% fibo at 0.6820.

https://roboforex.com/uploads/roboforecast/roboforex.com/99/2020/Fibo/august/06/AUDUSDH4.png

Read more - Fibonacci Retracements Analysis AUDUSD, USDCAD

Posts: 201 to 225 of 1,098

Pages Previous 1 7 8 9 10 11 44 Next

You must login or register to post a reply

Forex Software → Market Analysis → Forex Technical Analysis & Forecast by RoboForex

Similar topics in this forum