Re: Forex Technical Analysis & Forecast by RoboForex
Japanese Candlesticks Analysis 06.02.2020 (GOLD, NZDUSD)
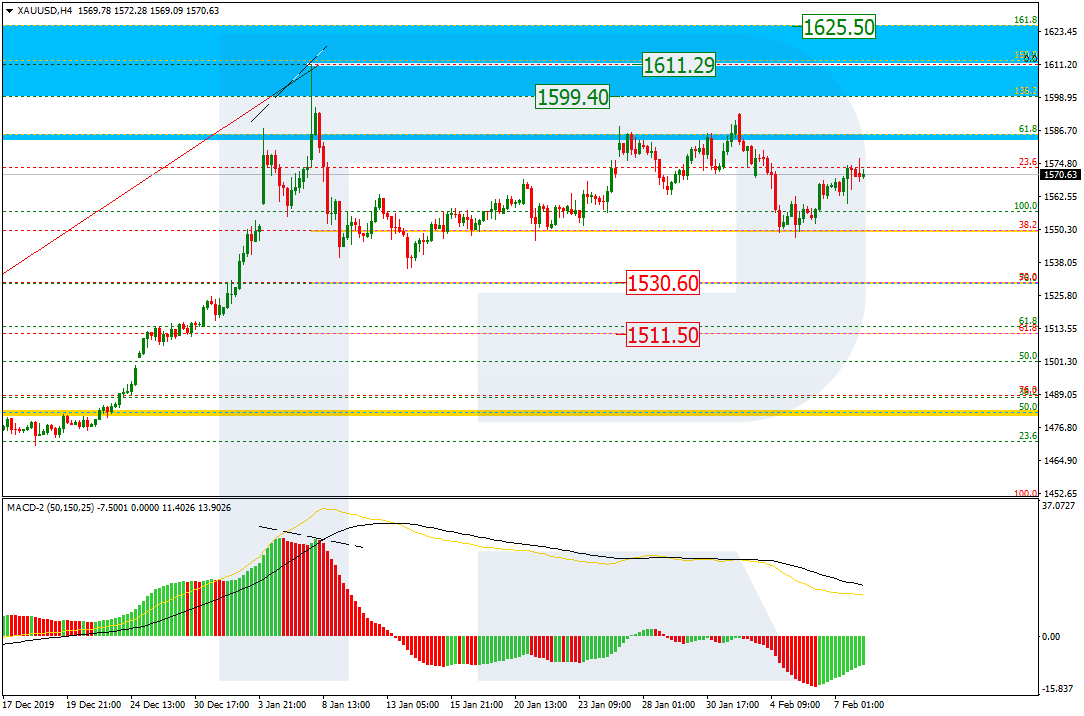
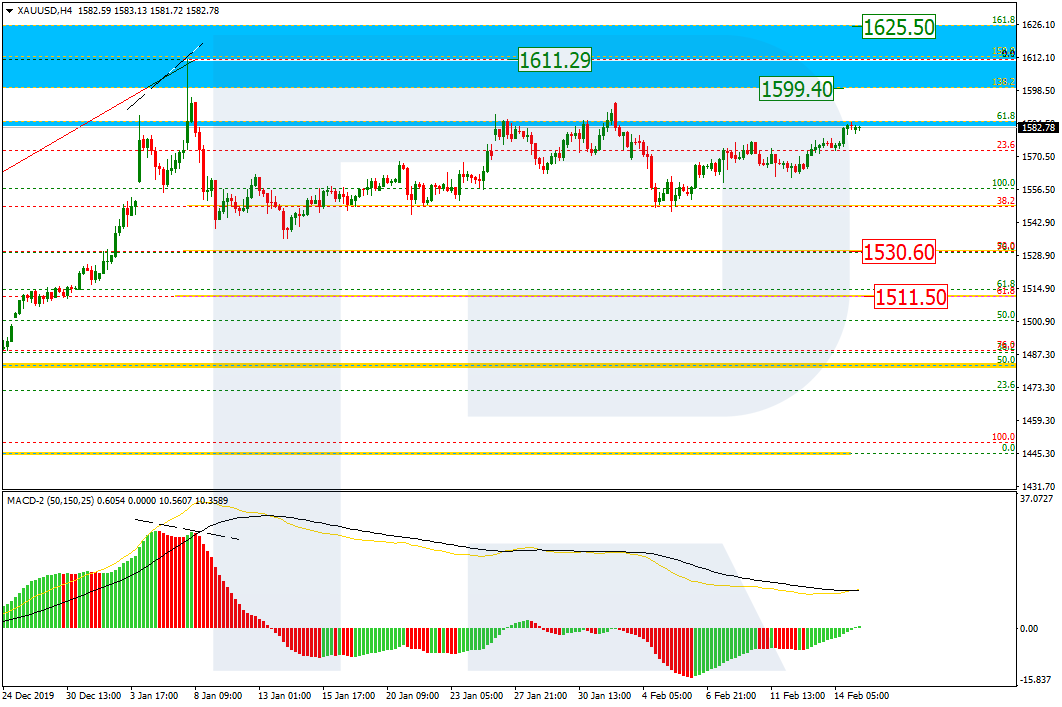
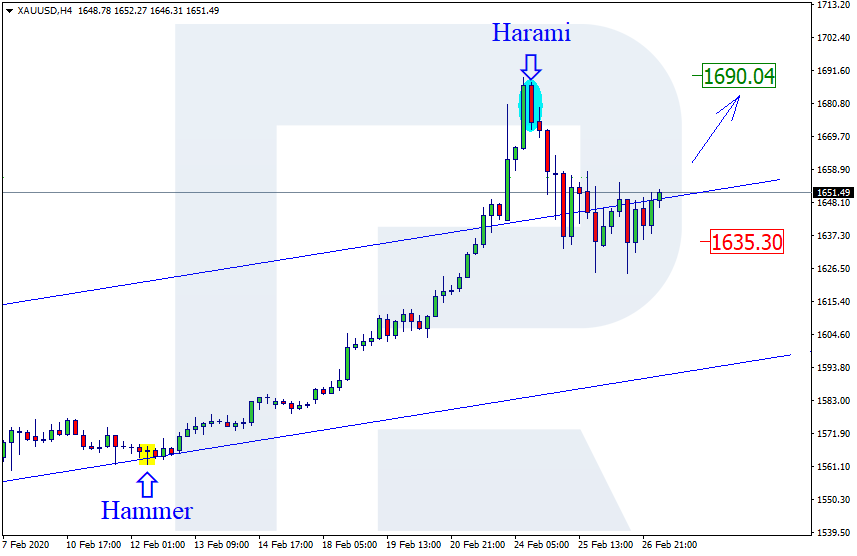
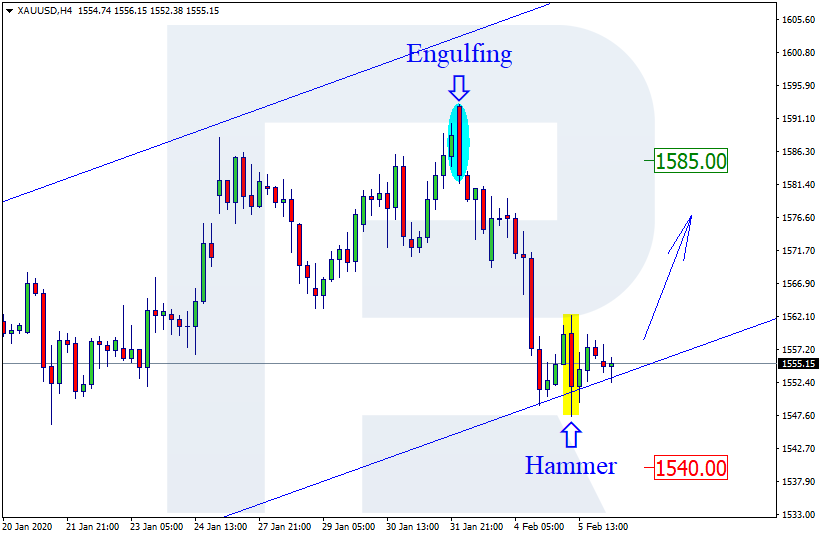
XAUUSD, “Gold vs US Dollar”
As we can see in the H4 chart, the ascending tendency continues. By now, XAUUSD has completed several reversal patterns, such as Hammer, near the channel’s downside border. At the moment, the pair is reversing. The upside target may be at 1585.00. However, one shouldn’t ignore another scenario, according to which the instrument may resume falling towards 1540.00.
Read more - Japanese Candlesticks Analysis GOLD, NZDUSD