forex software

Create and Test Forex Strategies

forex software

Skip to forum content

Forex Software

Create and Test Forex Strategies

You are not logged in. Please login or register.


(Page 20 of 62)

Forex Software → Market Analysis → InstaForex Analysis

Pages Previous 1 18 19 20 21 22 62 Next

You must login or register to post a reply

RSS topic feed

Posts: 476 to 500 of 1,547

Re: InstaForex Analysis

Forecast for USD/JPY on January 14, 2020

USD/JPY
Stock indices of the US market continue to set new records, along with them are rising Japanese indices and the USD/JPY pair. Yesterday, the S&P 500 grew by 0.70%, while the Nikkei 225 is adding a comparable 0.73% today. The China A50 Chinese stock index is up 0.40%, obviously, awaiting tomorrow's signing of the first part of a trade agreement with the United States. The United States also excluded China from the list of currency manipulators. Also, US corporate reports for the fourth quarter of 2019 are starting, forecasts are optimistic. Today, the largest banks are set to report: Citigroup (earnings forecast of $1.84 per share versus $1.61 in the third quarter), JPMorgan Chase & Co (forecast of $2.34 versus $1.98 earlier), Wells Fargo ($1.12 versus $1.21, but also good). Market growth may continue.

https://forex-images.ifxdb.com/userfiles/20200114/analytics5e1d42551707d.png

So, if the price goes above the resistance of the red line of the price channel, we are waiting for the price in the target range of 110.83/98 formed by the extreme on November 27, 2017 and February 11, 2016. Here is the Fibonacci level of 123.6% of the growth branch from August 26 to December 2. The indicated trend line (110.26) is the upper limit of the downward price channel originating in August 2015, this is its important - overcoming the line can trigger the pair's growth by another order of two or three figures. The strength of the channel boundary is supported by the Fibonacci level of 110.0%.

https://forex-images.ifxdb.com/userfiles/20200114/analytics5e1d426ad1135.png

On the four-hour chart, the Marlin forms a divergence, perhaps before attacking the upper boundary of the price channel, the price will subside to the support of the MACD line on daily (109.50).

*The market analysis posted here is meant to increase your awareness, but not to give instructions to make a trade.

Analysis are provided byInstaForex.

Best regards, PR Manager / Learn more about InstaForex Company at http://instaforex.com

Re: InstaForex Analysis

Forecast for EUR/USD on January 15, 2020

EUR /USD
The dollar slightly strengthened on Tuesday, with the release of inflation data for the United States, but investors found the data not sufficient enough for a more decisive offensive. As a result, the euro showed a decline of only five points by the close of the day. The basic consumer price index added 0.1% for December against the expected 0.2%, while maintaining an annual value of 2.3%.

https://forex-images.ifxdb.com/userfiles/20200115/analytics5e1e8a39d6757.png

On the daily chart, the signal line of the Marlin oscillator moves sideways directly along the boundary of the bullish and bearish trends, which creates the risk of continued correctional growth to the Fibonacci level of 110.0% at the price of 1.1155. If the potential is not realized, a planned decrease to the Fibonacci level of 123.6% will follow at the price of 1.1073, where the MACD indicator line also passes.

https://forex-images.ifxdb.com/userfiles/20200115/analytics5e1e8a4f78039.png

On the four-hour chart, a price reversal from the MACD line was noted, but not fully realized. At the moment, the price is already above the balance line (red moving) and the Marlin oscillator is holding in the growth zone, which shows the price's intention to once again attack the MACD line. Now the condition for a further decrease is overcoming the price of yesterday's low.

In general, the situation is neutral and the euro may cheer up today's data on industrial production for November (forecast 0.3%), but tomorrow retail sales in the US for December will be released, the forecast for which is 0.5% for basic sales and 0.3% for general . It is likely that investors are planning more active actions for this data.

*The market analysis posted here is meant to increase your awareness, but not to give instructions to make a trade.

Analysis are provided byInstaForex.

Best regards, PR Manager / Learn more about InstaForex Company at http://instaforex.com

Re: InstaForex Analysis

Gold has come to life

The storm continues to rage in the gold market. Despite the fact that only two weeks have passed since the beginning of the year, the precious metal has already managed to go to 7-year highs, collapse like a stone, and then begin to recover thanks to bad news about the trade war. Bloomberg is actively spreading rumors that tariffs on $360 billion of Chinese imports will remain in force, at least until the US presidential election, because the White House needs to assess how Beijing is fulfilling its obligation to increase purchases of American agricultural and other products. The trade war, which has lasted just under two years, does not seem to be going to stop, which means that demand for safe-haven assets will remain high.

The conflict in the Middle East is gradually fading. The market is dominated by the view that the current XAU/USD correction is due to the mass closure of long speculative positions. Hedge funds in the week of January 7 increased them to the highest level since the end of September, probably hoping that the confrontation between US and Iran will be long-lasting. Some are still hoping for it. The Standard Chartered Bank notes that the price movement due to geopolitics was stronger than previously expected. HSBC raised its forecast for gold for 2020 from $1560 to $1613 per ounce.

In my opinion, the reasons for the strengthening of the precious metal should not be found in geopolitics, but in the activities of central banks, in politics and in trade disputes instead. The Fed has made it clear that even exceeding the 2% inflation target will not force it to abandon passive behavior. The regulator is ready to endure the acceleration of consumer prices during the period of economic expansion, which is good news for the "bulls" on XAU/USD. The precious metal is traditionally perceived as a tool for hedging inflation risks, asits dynamics have a lot in common with the changes in the US CPI.

The dynamics of gold and American inflation:

https://forex-images.ifxdb.com/userfiles/20200115/analytics5e1ef0248e97d.jpg

The dog is buried in the increased sensitivity of gold to the real yield of US Treasury bonds. In December, inflation in the United States grew by 2.3%. This is the second best indicator for a calendar year since 2011, when its growth rate was at 3%. In 2018, consumer prices rose by 1.9%, and by 1.6% on average for 10 years.

Another factor supporting XAU / USD is the propensity of the world's leading central banks to ultra-soft monetary policy, which keeps global debt market rates close to historical lows. At the same time, a large-scale monetary stimulus contributes to the devaluation of currencies, which increases the attractiveness of gold. If global GDP does not recover as quickly as expected, regulators will further weaken monetary policy. With tariffs on $360 billion of Chinese imports still in place, this is more than likely.

Technically, after reaching the target of 113% for the "Shark pattern", a natural pullback to the 38.2% Fibonacci correction level followed. Important Pivot levels are also located here. The fact that the "bulls" managed to hold support at $1545-1548 per ounce, the hopes of restoring the upward trend remains.

Gold, daily chart

https://forex-images.ifxdb.com/userfiles/20200115/analytics5e1ef038e5ba4.jpg

*The market analysis posted here is meant to increase your awareness, but not to give instructions to make a trade.

Analysis are provided byInstaForex.

Best regards, PR Manager / Learn more about InstaForex Company at http://instaforex.com

Re: InstaForex Analysis

Prospects and trends for gold in January and February 2020

The consolidation in the gold market ended with the New Year holidays as well as rocket salvos in Iraq, where the United States killed the commander of the Kudes Iranian unit, Qassem Soleimani. Thank God, the global war did not happen, but the nerves of the investors completely lost, and they rushed to buy gold in full accordance with the forecast published in early December 2019. However, the time has come to look at the prospects of the precious metal and make adjustments to the assessment of the situation.

As we know, the position of traders in futures contracts traded on the CME exchange has the greatest impact on the price of gold. The latest data from the Traders Obligations Report - Commitments of Traders (COT) Reports, published by the US Commodity Futures Commission - CFTC, indicates an increase in the volume of new money entering the market. In addition, the Open Interest of the gold futures contract grew from 926 thousand to 1197 thousand contracts, or almost one third between November 29 and January 10.

https://forex-images.ifxdb.com/userfiles/20200115/analytics5e1f72bdee0ed.jpg

Such an increase in the interest of market participants in gold, which took place against the backdrop of a rise in stock indices, suggests that the departure of the price of gold to the level of $ 1,600 per troy ounce was not an accident caused by the geopolitical situation. The assassination of the general was just an excuse for the precious metal to begin to rise again after a period of consolidation that lasted until the end of the fourth quarter.

Moreover, it is very important that the increase in the price of gold was supported by speculators Managed Money, whose long positions during the period from December to January grew from 225 thousand to 300 thousand contracts. According to the CFTC classification, Managed Money are a priori net buyers. Thus, the demand for gold from buyers was accompanied by the opening of new positions in the futures contract, which suggests fundamental reasons for the continuation of the current trend. Due to this, exchange traders felt the potential and began to increase positions.

If the increase in the price of gold was caused only by the development of events in the Middle East, then, firstly, we would not see a constant influx of new money that occurred in December, and secondly, Managed Money, which are speculators, could simply not react on the events that are happening.

So, for example, what happened in September 2019 and January 2020 in the oil market. The attack on the Saudi oil infrastructure was not supported by the influx of new money into the market, and speculators were in no hurry to open new long positions, which subsequently led to a decrease in oil prices. No demand - no price increase. In December, speculators bought oil, but almost no new positions were opened in the futures, which led to a decrease in oil prices as soon as the situation in the Persian Gulf area stabilized.

However, we have an increase in Open Interest in gold and an increase in purchases by speculators at the same time, which qualitatively distinguishes this situation from the situation in the oil market. On the other hand, the price of gold declined slightly after the crisis between Iran and the United States was resolved, and this is natural, but do not be fooled by the possibility of a potential reversal, since most likely there will not be a deep decline in the gold market.

We will analyze the positioning of traders in option contracts. The most liquid option contract now is the February contract OGG0 with the closure on January 28 (Fig. 1).

https://forex-images.ifxdb.com/userfiles/20200115/analytics5e1f72f1c1320.jpg

Figure 1: Open Interest in an OGGO Option Contract.

First of all, the significant predominance of "call" options over "put" options is noteworthy. The Put / Call Ratio coefficient is 0.71. This means that there are only 71 Put options for every 100 Call options. In the context of the growth of Open Interest, optional barriers may not withstand and miss the price higher. With this ratio, the importance of the Max Pain point located at 1500 also decreases, and returning to this point at the time the option contract expires is becoming less and less likely. This must be taken into account when opening gold sales positions. Option barriers hold the price well, but only when there is no trend on the market.

In this regard, it can be assumed that the levels of optional support are at 1510 and 1500. There are also graphic levels of price support, where gold can return by the end of the month for purely technical reasons. After that, there is a possibility of further price growth over the next three to six months, which implies a rise in gold to the level of $ 1,750 per troy ounce. Thus, sales to the levels of 1,500-1,510 dollars will be inappropriate, but such a price can be an ideal point for buying gold, unless, of course, by that time there will be a change in the mood of buyers in the futures market. Short-term goals for such purchases may be levels 1500, 1575 and 1600, formed by options such as "Call".

Today, the World Gold Council - published its forecast for 2020. The forecast indicates the main factors that, in the opinion of the Council, will affect the price of gold this year. It is assumed that financial uncertainty and low interest rates in most developed economies will support the price of gold, as investors will seek new sectors to protect investments and generate income. As a result, demand from central banks will also remain high. This, combined with investor interest, will allow gold to be added back to its value in all currencies.

According to WGC experts, the price impulse and positioning of traders will also support the price of gold. At the same time, volatility and expectations of weaker economic growth in the short term may lead to softer consumer demand, but structural economic reforms in India and China will support consumer demand in the long term.

Thus, traders trading can earn on price fluctuations by selling and buying precious metals on the best trading conditions, but investors should not forget that gold has provided them with a yield higher than the US dollar over the past twenty years, while performing a protection function risk investment.

By investing in gold and trading it in the short term, an investor can not only profit from fluctuations in price quotes, but also insure himself against unforeseen market risks. Be very careful and follow the rules of money management.

*The market analysis posted here is meant to increase your awareness, but not to give instructions to make a trade.

Analysis are provided byInstaForex.

Best regards, PR Manager / Learn more about InstaForex Company at http://instaforex.com

Re: InstaForex Analysis

Control zones of USDJPY 1/20/2020

Last week's movement made it possible for a local accumulation zone to form. This happened within the average monthly move, which indicates the presence of limit sell orders. Purchases from current levels are not profitable, since the probability of closing the trade in January is above the zone of the monthly move below 30%. A model has not yet been formed for selling, which indicates the need to switch to standby mode.

https://forex-images.ifxdb.com/userfiles/20200120/analytics5e250994e1453.png

Keeping part of the purchases opened at the beginning of this month is the optimal strategy, since the probability of absorption of the latest growth from current levels is below 20%.

To enter a short position requires the formation of an absorption pattern at the daily level. Closing of trading on Monday should occur below the low of last week. This will indicate the appearance of a major offer from significant market players. Work in the downward direction is more profitable, since the monthly range of the average stroke has already been overcome by the pair....

https://forex-images.ifxdb.com/userfiles/20200120/analytics5e2509abbef45.png

Daily CZ - daily control zone. The area formed by important data from the futures market, which changes several times a year.
Weekly CZ - weekly control zone. The zone formed by important marks of the futures market, which changes several times a year.
Monthly CZ - monthly control zone. The zone, which is a reflection of the average volatility over the past year.

*The market analysis posted here is meant to increase your awareness, but not to give instructions to make a trade.

Analysis are provided byInstaForex.

Best regards, PR Manager / Learn more about InstaForex Company at http://instaforex.com

Re: InstaForex Analysis

Fractal analysis for major currency pairs on January 21

Forecast for January 21:
Analytical review of currency pairs on the scale of H1:

https://forex-images.ifxdb.com/userfiles/20200121/analytics5e2653b151bdc.png

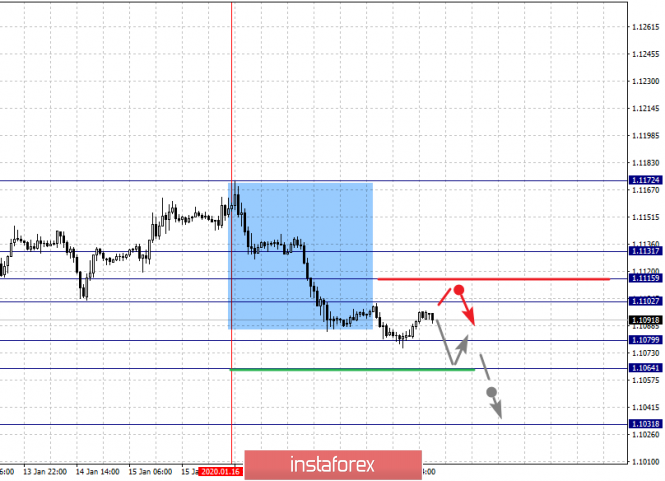
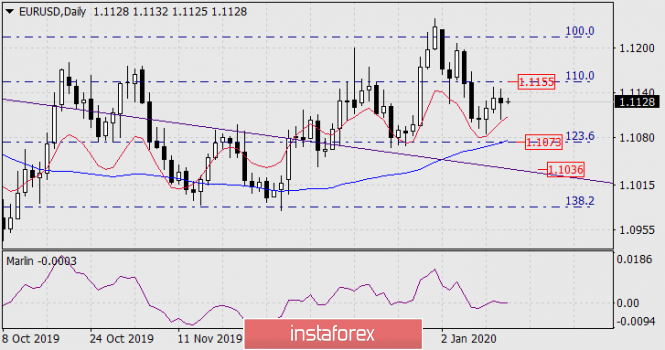
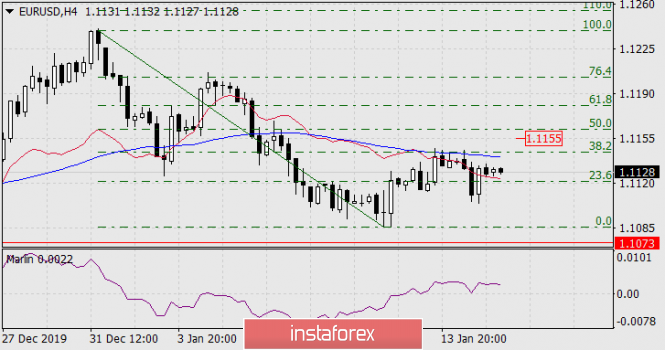
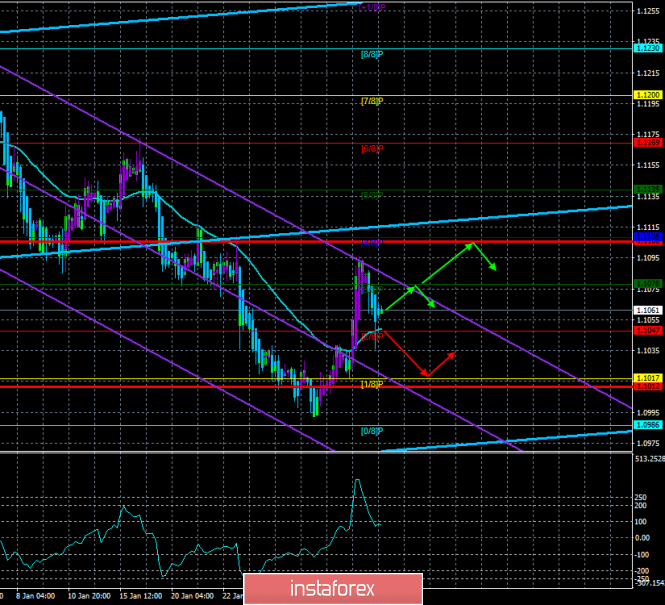
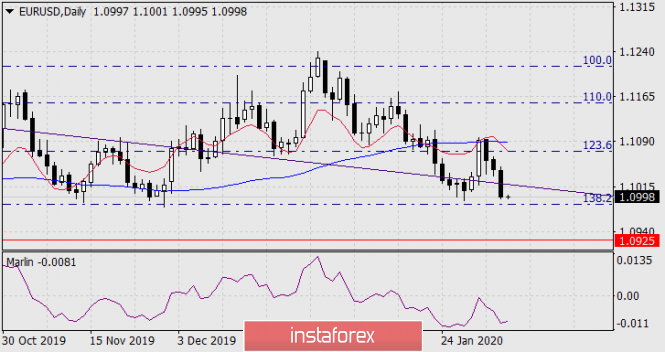
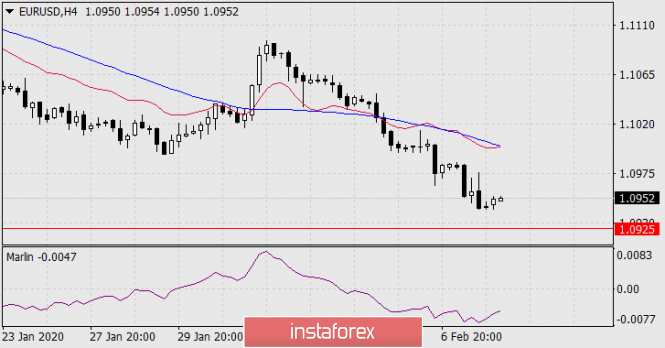
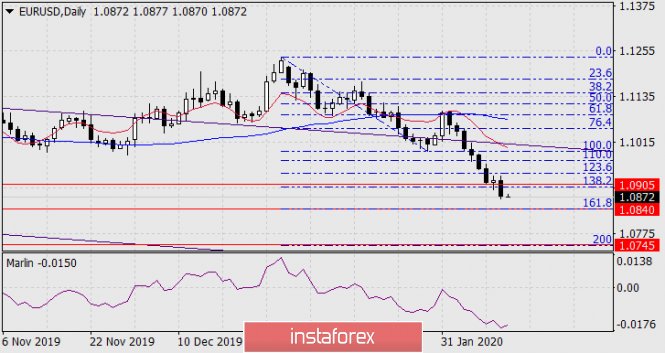
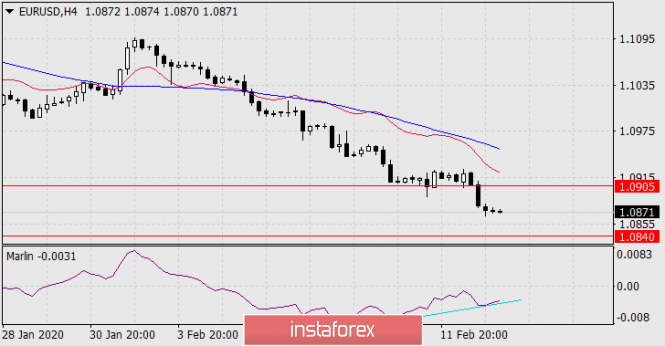
For the euro / dollar pair, the key levels on the H1 scale are: 1.1131, 1.1115, 1.1102, 1.1079, 1.1064 and 1.1031. Here, we are following the descending structure of January 16.

Short-term downward movement is expected in the range of 1.1079 - 1.1064. The breakdown of the last value will lead to a pronounced movement. Here, the potential target is 1.1031. We expect a pullback to the top from this level. Short-term upward movement is possibly in the range 1.1102 - 1.1159. The breakdown of the last value will lead to an in-depth correction. Here, the target is 1.1131. This level is a key support for the downward structure.

The main trend is the descending structure of January 16

Trading recommendations:
Buy: 1.1102 Take profit: 1.1113
Buy: 1.1116 Take profit: 1.1130
Sell: 1.1078 Take profit: 1.1065
Sell: 1.1063 Take profit: 1.1034

https://forex-images.ifxdb.com/userfiles/20200121/analytics5e2653cc0b0b3.png

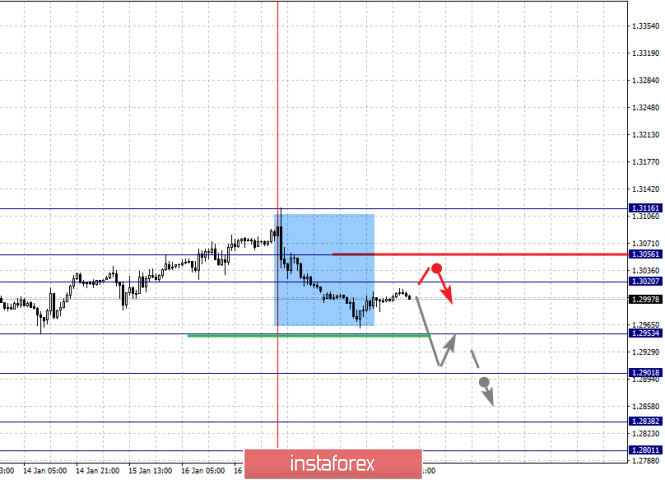
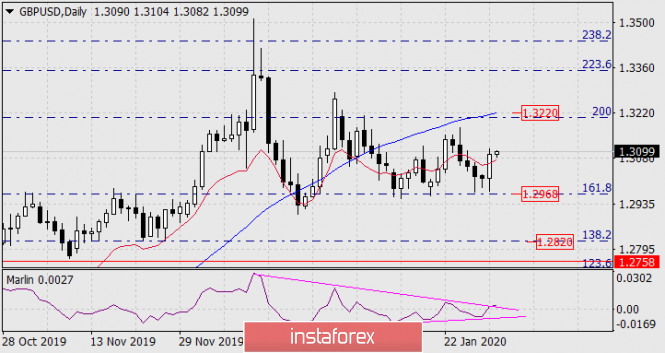
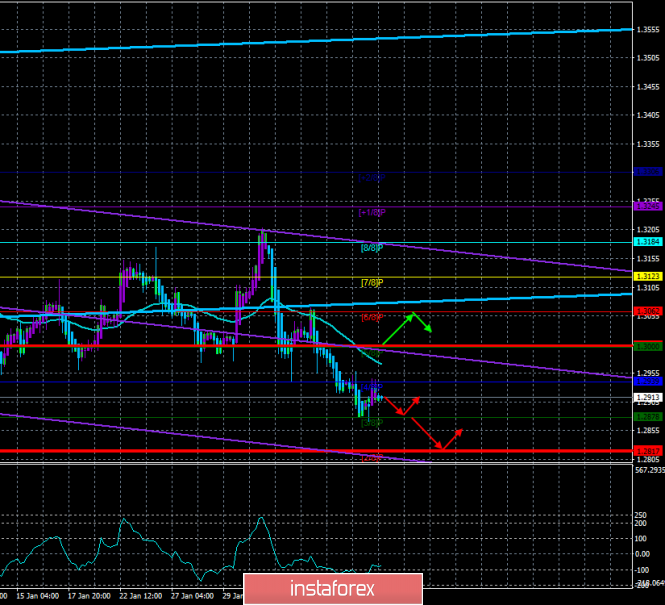
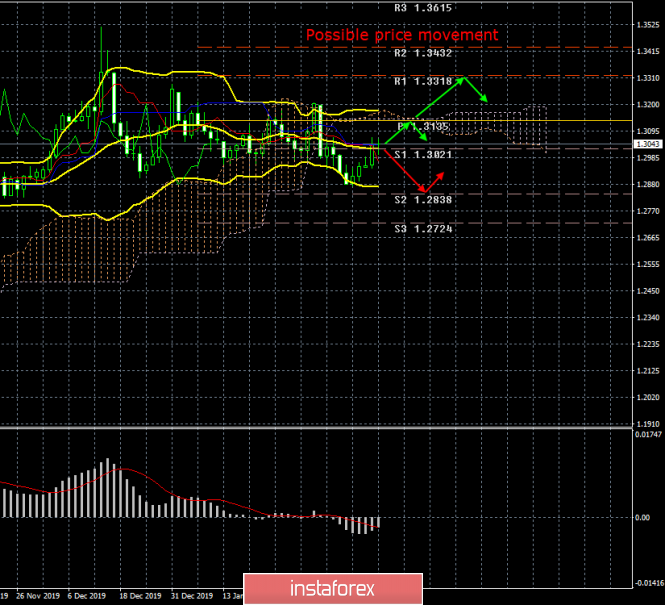
For the pound / dollar pair, the key levels on the H1 scale are: 1.3116, 1.3056, 1.3020, 1.2953, 1.2901, 1.2838 and 1.2801. Here, we are following the formation of the descending structure of January 17. The continuation of the movement to the bottom is expected after the breakdown of the level of 1.2953. In this case, the target is 1.2901. Price consolidation is near this level. The breakdown of the level of 1.2900 will lead to the development of pronounced movement. Here, the goal is 1.2838. For the potential value for the bottom, we consider the level of 1.2801. Upon reaching which, we expect a pullback to the top.

Short-term upward movement is possibly in the range of 1.3020 - 1.3056. The breakdown of the latter value will lead to the formation of initial conditions for the upward cycle. Here, the potential target is 1.3116.

The main trend is the descending structure of January 17

Trading recommendations:
Buy: 1.3020 Take profit: 1.3053
Buy: 1.3057 Take profit: 1.3114
Sell: 1.2952 Take profit: 1.2904
Sell: 1.2898 Take profit: 1.2838

https://forex-images.ifxdb.com/userfiles/20200121/analytics5e2653e4cfb11.png

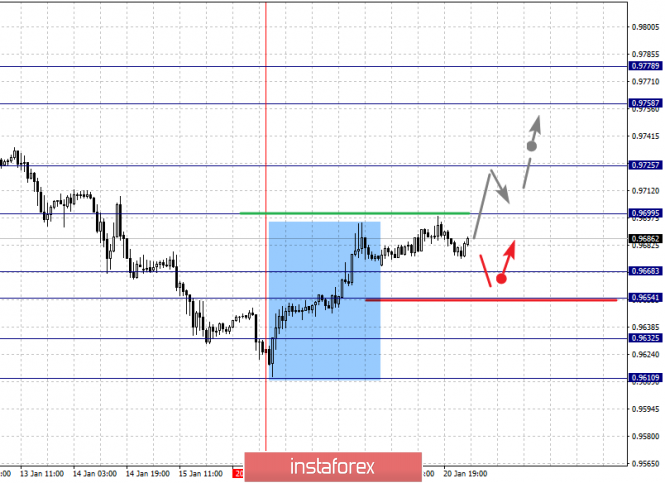
For the dollar / franc pair, the key levels on the H1 scale are: 0.9778, 0.9758, 0.9725, 0.9699, 0.9668, 0.9654, 0.9632 and 0.9610. Here, the price forms the expressed initial conditions for the top of January 16. The continuation of the movement to the top is expected after the breakdown of the level of 0.9700. In this case, the target is 0.9725. Price consolidation is near this level. The breakdown of the level of 0.9725 will lead to pronounced movement. Here, the target is 0.9758. For the potential value for the top, we consider the level of 0.9778. Upon reaching this level, we expect a pullback to the bottom.

Short-term downward movement is possibly in the range of 0.9668 - 0.9654. The breakdown of the latter value will lead to an in-depth correction. Here, the target is 0.9632. This level is a key support for the top.

The main trend is the formation of initial conditions for the top of January 16

Trading recommendations:
Buy : 0.9700 Take profit: 0.9725
Buy : 0.9727 Take profit: 0.9756
Sell: 0.9667 Take profit: 0.9655
Sell: 0.9652 Take profit: 0.9635

https://forex-images.ifxdb.com/userfiles/20200121/analytics5e2653ff31c2c.png

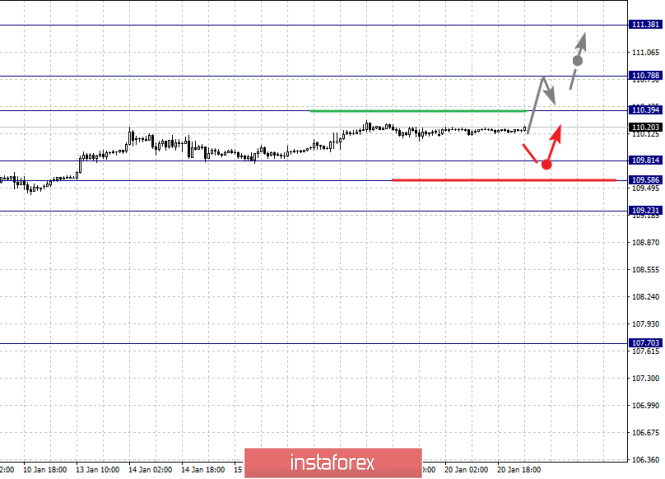
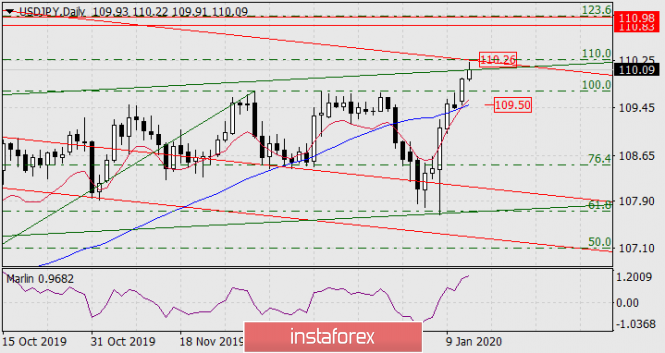
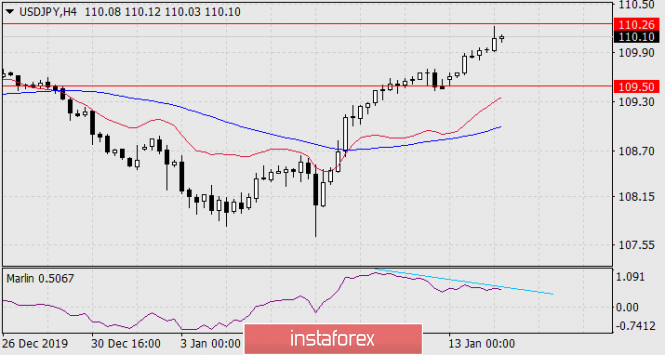
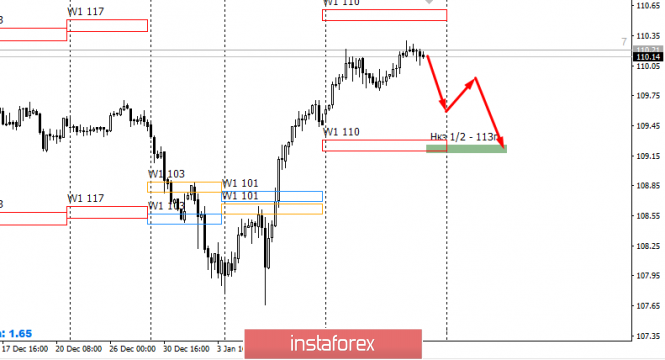
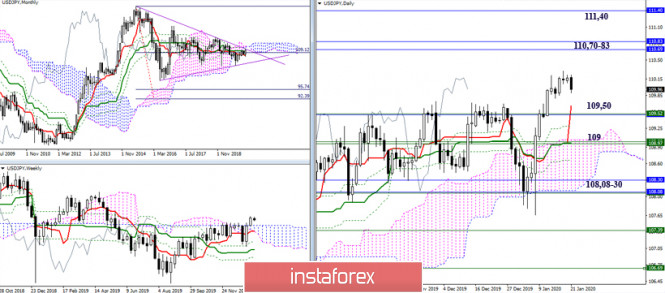
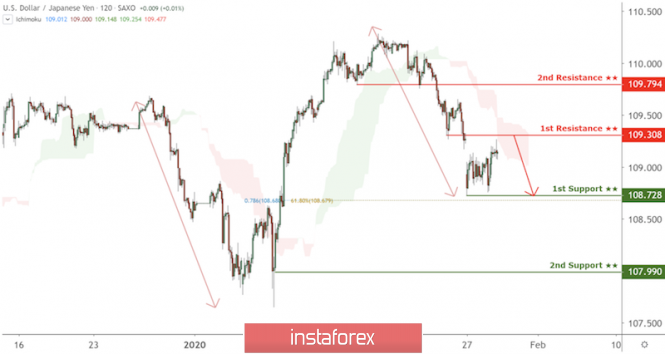
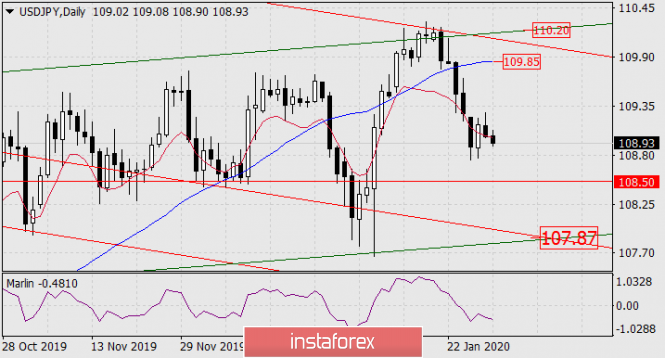
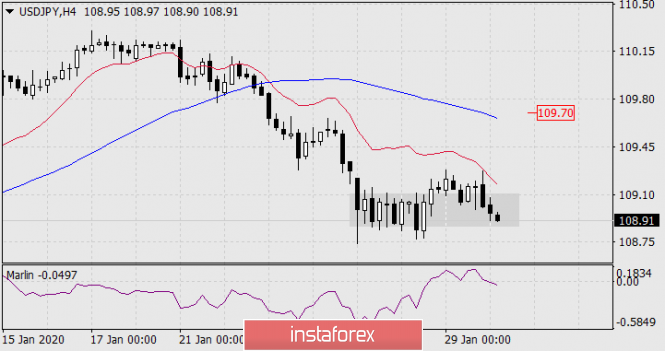
For the dollar / yen pair, the key levels on the scale are : 111.38, 110.78, 110.39, 109.81, 109.58 and 109.23. Here, we are following the development of the upward cycle of January 8. At the moment, we expect to reach the level of 110.39. The breakdown of which will allow us to count on movement to the level of 110.78. Price consolidation is near this value. The breakdown of the level of 110.80 should be accompanied by a pronounced upward movement. Here, the potential target is 111.38. Short-term downward movement is possibly in the range 109.81 - 109.58. The breakdown of the last value will lead to an in-depth correction. Here, the goal is 109.23. This level is a key support for the top. The main trend: the upward cycle of January 8.

Trading recommendations:
Buy: 110.40 Take profit: 110.76
Buy : 110.80 Take profit: 111.35
Sell: 109.80 Take profit: 109.58
Sell: 109.55 Take profit: 109.25

https://forex-images.ifxdb.com/userfiles/20200121/analytics5e26541c0438a.png

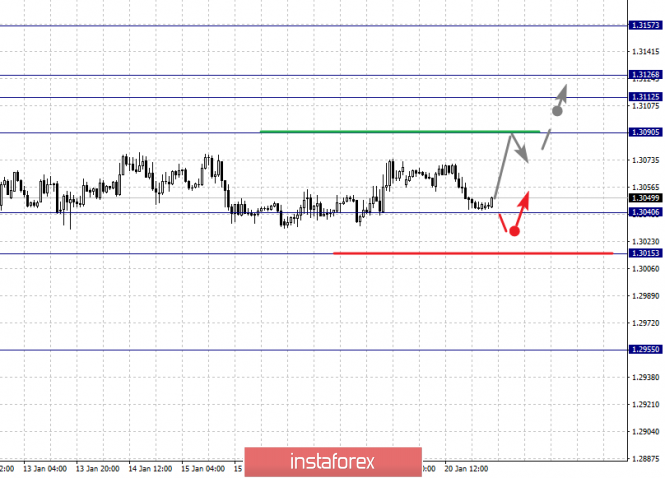
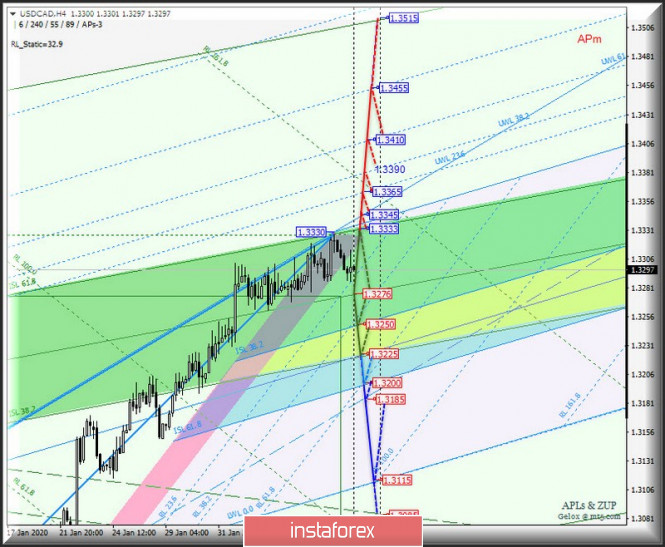
For the Canadian dollar / US dollar pair, the key levels on the H1 scale are: 1.3157, 1.3126, 1.3112, 1.3090, 1.3062, 1.3040 and 1.3015. Here, we are following the development of the upward cycle of January 7. The continuation of the movement to the top is except after the breakdown of the level of 1.3090. In this case, the target is 1.3112. Price consolidation is in the range of 1.3112 - 1.3126. For the potential value for the top, we consider the level of 1.3157. Upon reaching this level, we expect a pullback to the bottom.

Short-term downward movement, as well as consolidation are possible in the range of 1.3040 - 1.3015. The breakdown of the latter value will lead to the formation of initial conditions for the downward cycle. In this case, the potential target is 1.2988.

The main trend is the upward cycle of January 7, the correction stage

Trading recommendations:
Buy: 1.3090 Take profit: 1.3112
Buy : 1.3126 Take profit: 1.3155
Sell: 1.3038 Take profit: 1.3017
Sell: 1.3013 Take profit: 1.2990

https://forex-images.ifxdb.com/userfiles/20200121/analytics5e265437de2bf.png

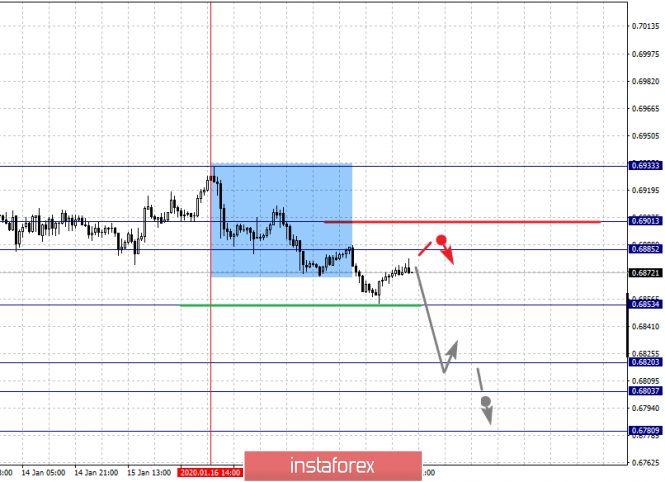
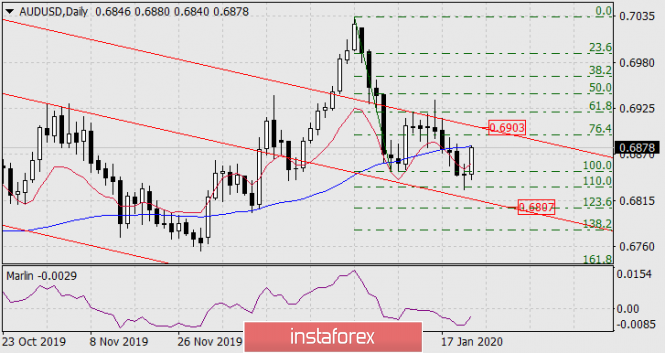
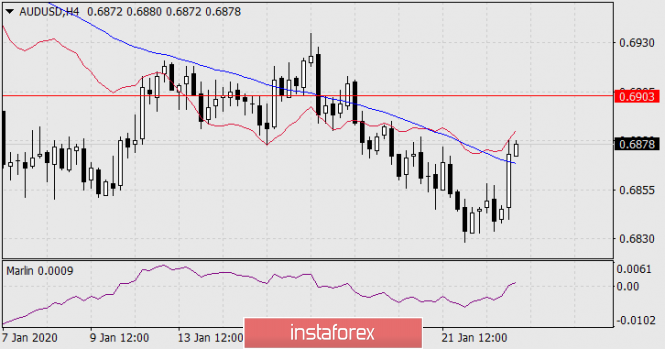
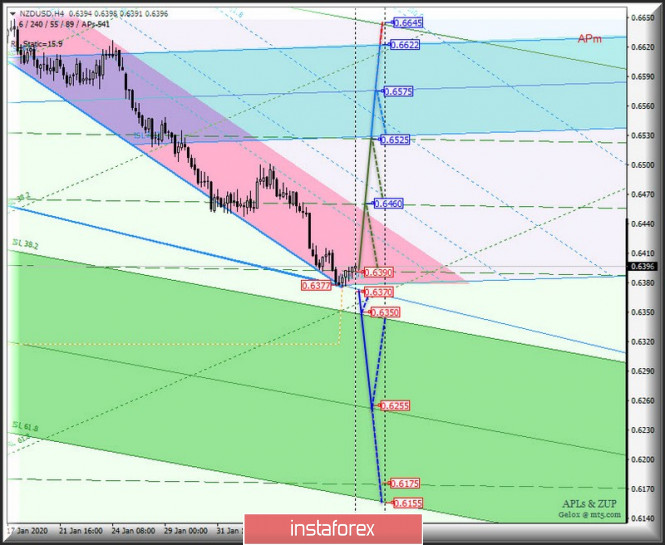
For the Australian dollar / US dollar pair, the key levels on the H1 scale are : 0.6933, 0.6901, 0.6885, 0.6853, 0.6820, 0.6803 and 0.6780. Here, we are following the development of the descending structure of January 16. The continuation of movement to the bottom is expected after the breakdown of the level of 0.6853. In this case, the target is 0.6820. Price consolidation is in the range of 0.6820 - 0.6803. For the potential value for the bottom, we consider the level of 0.6780. Upon reaching this level, we expect a pullback to the top.

Short-term upward movement is expected in the range of 0.6885 - 0.6901. The breakdown of the latter value will lead to the formation of initial conditions for the top. In this case, the potential target is 0.6933. The main trend is the descending structure of January 16

Trading recommendations:
Buy: 0.6885 Take profit: 0.6900
Buy: 0.6904 Take profit: 0.6930
Sell : 0.6851 Take profit : 0.6823
Sell: 0.6820 Take profit: 0.6804

https://forex-images.ifxdb.com/userfiles/20200121/analytics5e265455aa8b8.png

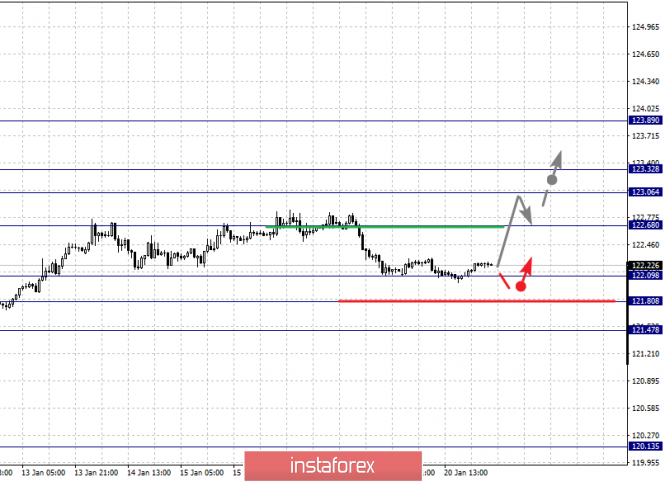
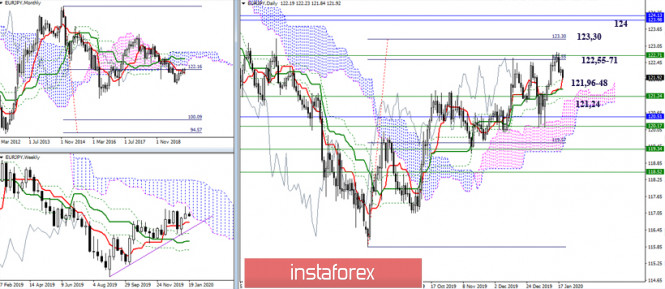
For the euro / yen pair, the key levels on the H1 scale are: 123.89, 123.32, 123.06, 122.68, 122.09, 121.80 and 121.47. Here, we are following the development of the upward cycle of January 8. The continuation of the movement to the top is expected after the breakdown of the level of 122.68. In this case, the first target is 123.06. Short-term upward movement, as well as consolidation is in the range of 123.06 - 123.32
.The breakdown of the level of 123.35 will lead to a movement to a potential target - 123.89, from this level, we expect a pullback to the bottom.

Short-term downward movement is possibly in the range of 122.09 - 121.80. The breakdown of the latter value will lead to an in-depth correction. Here, the goal is 121.47. This level is a key support for the upward structure.

The main trend is the upward cycle of January 8, the correction stage

Trading recommendations:
Buy: 122.70 Take profit: 123.05
Buy: 123.06 Take profit: 123.30
Sell: 122.07 Take profit: 121.84
Sell: 121.80 Take profit: 121.50

https://forex-images.ifxdb.com/userfiles/20200121/analytics5e2654742b3d0.png

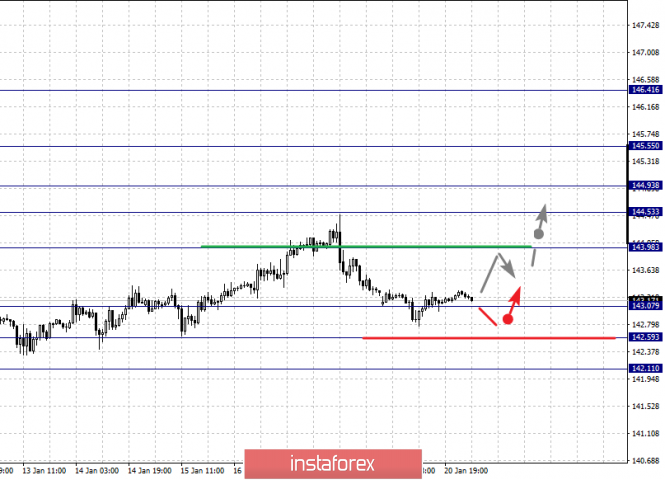
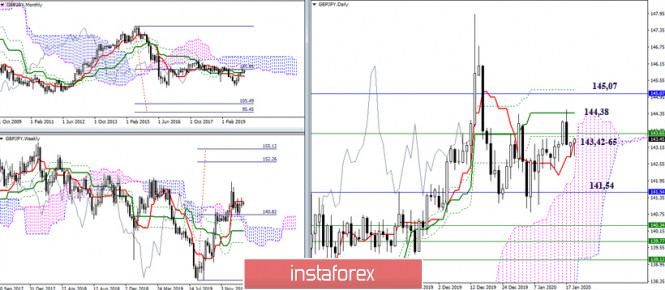
For the pound / yen pair, the key levels on the H1 scale are : 146.41, 145.55, 144.93, 144.53, 143.98, 143.07, 142.59 and 142.11. Here, we are following the development of the ascending structure of January 3. At the moment, the price is in correction. The resumption of movement to the top is expected after the breakdown of the level of 144.00. In this case, the first goal is 144.53. Short-term upward movement is expected in the range of 144.53 - 144.93. The breakdown of the latter value will lead to a movement to the level of 145.55, and near which, we expect consolidation. For the potential value for the top, we consider the level of 146.41, from which we expect a pullback to the bottom.

Short-term downward movement is possibly in the range of 143.07 - 142.59. The breakdown of the latter value will lead to the formation of initial conditions for the downward cycle. In this case, the potential target is 142.11.

The main trend is the upward structure of January 3, the correction stage

Trading recommendations:
Buy: 144.00 Take profit: 144.51
Buy: 144.53 Take profit: 144.91
Sell: 143.05 Take profit: 142.65
Sell: 142.54 Take profit: 142.11

Analysis are provided byInstaForex.

Best regards, PR Manager / Learn more about InstaForex Company at http://instaforex.com

Re: InstaForex Analysis

Technical analysis recommendations for USD/JPY and its crosses

USD / JPY

https://forex-images.ifxdb.com/userfiles/20200121/analytics5e26d39fc110d.jpg

The yen began in 2020 with the realization of what did not work out last year. So far, the pair closed the week in the bullish zone of the relative weekly cloud. Now, the main task of the players is fixing in this zone to increase in the near future. After that, monthly resistance will follow 110.70 - 110.83 - 111.40. However, breaking through the monthly boundaries is a more difficult task, since this will eliminate the monthly dead cross and mark the exit to the bullish zone of the relative Ichimoku cloud at the most upper time. In this situation, support is located at 109.50 (weekly cloud + monthly medium-term trend + daily short-term trend) - 109 (weekly Tenkan and the lower border of the cloud + daily Kijun and the upper border of the cloud) - Fixing below 108.08-30 can move players away from their goals for a long time.

EUR / JPY

https://forex-images.ifxdb.com/userfiles/20200121/analytics5e26d3b4a0f22.jpg

At the beginning of the year, the pair attempted a new test of important resistance, but the first target of the daily target for breakdown of the cloud (122.55), now strengthened by the lower border of the weekly cloud (122.71), withstood the defense again. As a result, we observe the next development of a downward correction. The nearest support is the daytime cross of Ichimoku, first Tenkan (121.96), then Kijun (121.48), as well as the most protected area 121.24 (weekly Tenkan + daytime cloud + final line of the daytime cross of Ichimoku). At the same time, securing below can significantly affect the current balance of power, opening up new prospects for players to decline.

GBP / JPY

https://forex-images.ifxdb.com/userfiles/20200121/analytics5e26d3cc2f799.jpg

The pound / yen is trying to gain a foothold and stay in the bullish zone relative to the weekly cloud, using the cloud as support. Now, the main attention of the players to increase is aimed at breaking through the weekly short-term trend (143.65) and eliminating the dead crosses of Ichimoku at the daily (144.38 - 145.21) and monthly (145.07) time intervals. Moreover, breaking through these resistance forms new horizons and opportunities before the players to increase. The nearest support, in turn, can now be identified at 141.54 (monthly medium-term trend + daily cloud) and 140.34 - 139.12 (weekly levels + lower border of the daily cloud). Fixing below will change the existing balance and can lead to an active recovery of bearish sentiment.

Ichimoku Kinko Hyo (9.26.52), Pivot Points (classic), Moving Average (120)

Analysis are provided byInstaForex.

Best regards, PR Manager / Learn more about InstaForex Company at http://instaforex.com

Re: InstaForex Analysis

Forecast for AUD/USD on January 23, 2020

AUD / USD

The Australian dollar absorbed a positive market sentiment relative to the British pound yesterday, and just this morning, this news was actively played back on the positive employment data. By December, about 29 thousand people got a job, this is contrary and higher than the 15 thousand on the forecast. This makes the overall unemployment rate fell from 5.2% to 5.1%. In the Asian session, the growth of the "Australian dollar" graduated to 34 points, and the price exactly reached the MACD line on the daily chart. In the European session, exit above the line 0.6880 with consolidation above it and on Friday, the growth may extend to the price channel line 0.6903.

https://forex-images.ifxdb.com/userfiles/20200123/analytics5e290a771781d.png

The price exceeded the MACD line on the four-hour chart but is still under the balance line, which means that the situation is developing mainly according to the older chart. For this day, everything will depend on whether the price can fix itself above the MACD line on the daily chart. The signal line of the Marlin oscillator in the zone of positive values is already a sign of the price's intention to overcome the resistance of the senior TF, but in any scenario this growth is corrective.

https://forex-images.ifxdb.com/userfiles/20200123/analytics5e290a99a2290.png

*The market analysis posted here is meant to increase your awareness, but not to give instructions to make a trade.

Analysis are provided byInstaForex.

Best regards, PR Manager / Learn more about InstaForex Company at http://instaforex.com

Re: InstaForex Analysis

EUR/USD: Christine Lagarde pessimism and panic over 2019-nCoV

The euro-dollar pair is plunging down: at the moment, the bears are trying to gain a foothold below the support level of 1.1050 in order to discover the way to the area of the ninth figure. Although in the morning the pair showed corrective growth, in the hope of hawkish notes from the ECB. But to the disappointment of the EUR/USD bulls, Thursday events turned against the European currency. And it's not just because of Christine Lagarde's overly cautious rhetoric. The financial world today has finally succumbed to panic about the spread of the deadly 2019-nCoV virus. Demand for defensive assets has increased again, as well as that for the US currency, which many investors use as a kind of safe-haven in times of heightened uncertainty. In other words, the EUR/USD bulls hope for a resumption of the upward trend burst like a soap bubble - Lagarde could not support the single currency, while the anti-risk sentiment only increased the pressure on the pair.

https://forex-images.ifxdb.com/userfiles/20200124/analytics5e2a2ec2bc186.jpg

The European Central Bank today, quite expectedly, left all the parameters of monetary policy unchanged. In its accompanying statement, the regulator indicated that the ECB rates will remain at the current "or lower level" until inflation approaches the target two percent level "or close enough to this target". This wording was not a surprise to traders. The only innovation in the final communique is the announcement that the ECB will conduct a strategic review of its policy (for the first time in 17 years). However, firstly, this process will take about a year, and secondly, the regulator has not yet shared any details regarding the scope of the policy review. Therefore, the main attention of traders today was riveted to the press conference of Christine Lagarde.

It cannot be said that the head of the ECB took a peremptory-dovish position. Not at all. During her speech, she, in particular, stated that "current rates are worrisome," therefore, in the future, the regulator will take into account the collateral effect of low rates. This statement suggests that there is still a split in the ECB, which appeared back in September last year, when Mario Draghi "pushed" the decision to resume QE. Some of the central bank members then also expressed their concern about the side effect of negative rates.

However, the above remark could not provide the euro with long-term support. Lagarde generally maintained a pessimistic stance on the current situation. First of all, according to the head of the ECB, industrial production is a "brake"on the European economy. On the whole, the existing risks are "tilted downward," although they are less pronounced compared to last year. Despite the signing of the first phase of a trade deal between the US and China, the ECB continues to be concerned about this protracted trade conflict. Lagarde uttered a rather capacious phrase on this subject: "... geopolitics is a threat that leaves the door open for accommodation policy." At the same time, Lagarde rather modestly commented on the growth of European inflation. According to her, the regulator noted "some signs of growth", however, these trends "correspond to earlier expectations". Summing up the January meeting, the head of the ECB said that monetary policy will remain stimulating "for a long period of time", despite some signs of stabilization of the situation in the eurozone.

Buyers of the EUR/USD pair certainly expected more from today's meeting. Previous macroeconomic releases made it possible to count on a more hawkish tone by the central bank chief. Therefore, following the meeting, the pair updated the daily low. But ironically, the press conference of Lagarde coincided with a general increase in anti-risk sentiment in the markets. For example, the yen paired with the greenback fell to the bottom of the 109th figure, and the dollar index jumped to a one-month high (the last time it was at 97.57 points in early December), reflecting investor demand for defensive instruments. Stock indices - on the contrary, collapsed.

https://forex-images.ifxdb.com/userfiles/20200124/analytics5e2a2ed62b8c0.jpg

Asian markets have been hit hardest. In particular, the Hong Kong Hang Seng index fell 2.8%, the Shanghai blue chips index fell 1.7%, and the Japanese Nikkei lost 0.9%. The shares of tourism and passenger transportation companies (including airlines) fell most strongly. There is growing concern in financial markets that a virus spreading from China could slow global growth. Cases of infection have already been recorded in Taiwan, Thailand, Japan, South Korea, Saudi Arabia and the United States. The authorities of the PRC quarantined two cities in Hubei province (including the 11 millionth Wuhan), canceling all the large-scale events in Beijing dedicated to the celebration of the New Year on the lunar calendar (January 25).

Such unprecedented measures have reminded traders of the effects of the 2003 pneumonia epidemic. Then the key countries of the Asian region in total lost, according to various estimates, from 30 to 40 billion dollars. (first of all, the tourism sector has suffered). The oil market fell then, due to a significant decrease in air transportation, and, accordingly, the demand for aviation fuel and crude oil.

It is worth noting that at the moment it is impossible to say with certainty that a repetition of the year 2003 awaits us, however, in the context of the prospects of the foreign exchange market (and directly the EUR/USD pair), the very fact that traders succumbed to panic is important. If the situation with the spread of the virus will gain momentum, the pair will continue to decline, despite the other fundamental factors. So far, the EUR/USD bulls are defending - the bears have failed to gain a foothold below the support level of 1.1050. But in the event of an increase in anti-risk sentiment, buyers of the pair will not be able to maintain this level - the price will drop to the ninth figure.

*The market analysis posted here is meant to increase your awareness, but not to give instructions to make a trade.

Analysis are provided byInstaForex.

Best regards, PR Manager / Learn more about InstaForex Company at http://instaforex.com

Re: InstaForex Analysis

GBP/USD. UK after Brexit: waiting for collapse?

https://forex-images.ifxdb.com/userfiles/20200127/analytics5e2e352c48d9a.png

The UK will officially leave the European Union in five days. More precisely, the so-called "transition period" will begin, with which many identify the beginning of the real Brexit. Over the next 11 months, little will change for Great Britain. The country will cease to take part in the decision-making of the European Union, the British deputies will leave the European Parliament, however, the established trade relations and other rules and regulations by which the UK has lived in recent years will remain in force. Now, a month and a half after Boris Johnson's victory in the election, when passions and euphoria subsided, many experts conclude that the victory of the Conservatives is a result of the fragmentation of the political views of the opponents of Brexit, and not the excessive popularity of Conservatives among the people. In other words, there was only one option with the end of Brexit - vote for the Conservatives, and there were much more options against Brexit. At the same time, both the Scots, the Northern Irish, and the Welsh, supporting Brexit, had to vote not for "their" parties, but all for those Conservatives. For those who reject Brexit, they voted for the Scottish National Party, for the Labour Party, and for other political forces. As a result, all the voices of the opponents of Brexit were divided into 3-4 parties, all the voices of the supporters of Brexit left the party of Boris Johnson. However, now all this is not important. It's important - what the odious prime minister and his ruling party will lead the country to.

In fact, in the coming year, all questions to Johnson's team come down to whether he will be able to agree with the U on a new trade deal that will operate after the end of the transition period? According to many experts, the main thing that is required of Johnson is to sign such a deal that does not harm the UK economy as much as possible, which has been losing huge amounts over the past three years due to Brexit and, in any case, will continue to lose them in 2020. Nobody believes that the deal will be the way Johnson himself sees it. Johnson is not Trump, but the European Union is not China. The biggest question that causes skepticism among all market participants is the timing of negotiations on trade relations with the EU. Eleven months is very little to conclude such a comprehensive deal. Thus, either Johnson will be able to conclude a "surface" agreement in a short time, or he will have to extend the transition period for two years (which Johnson does not want) and conduct more meaningful negotiations, without forcing events and slowly.

Well, the biggest danger for London now comes from Edinburgh. Nicola Sturgeon, the first Minister of Scotland, has repeatedly stated that "London will not be able to lock us up and hope that everything will work out." Scotland opposes an exit from the EU, but advocates an exit from the UK if its interests are not taken into account by the government of Johnson. "If the UK continues to exist, it is only on the basis of universal consent," said Sturgeon. A formal request for a second independence referendum has already been sent to Johnson and has been rejected. However, it is unlikely that Edinburgh will so simply dwell on the refusal of permission to referendum. In the best case for Britain, the Scots will regularly put this issue on the agenda. At worst, separatism, refusal to subordinate to London, and unauthorized referendum are possible. I don't even want to think about what awaits Britain in the second case. Riots, a military conflict and a host of other "unpleasant things" are possible. Thus, all those who, following Johnson's victory in the elections, exhaled and considered that all the troubles are now behind, all that can be said is that all the troubles are still ahead, and Brexit now looks like the smallest of the problems of Great Britain.

*The market analysis posted here is meant to increase your awareness, but not to give instructions to make a trade.

Analysis are provided byInstaForex.

Best regards, PR Manager / Learn more about InstaForex Company at http://instaforex.com

Re: InstaForex Analysis

EUR/USD: euro threatened by the epidemic

https://forex-images.ifxdb.com/userfiles/20200128/analytics5e2f80259a3ae.jpg

According to a consensus estimate by Bloomberg analysts, the euro will rise to $1.14 against the US currency by the end of June. The increasing geopolitical risks in the Middle East, the outbreak of coronavirus in China and the threat of a trade war between Washington and Brussels made investors doubt the realism of this forecast.

Although many believe the new virus is less dangerous than SARS in 2003, the worst is probably yet to come. Globalization, more developed than at the beginning of the century, the infrastructure of China and the tendency of the latter to travel to the Lunar New Year are factors that can contribute to the rapid spread of coronavirus throughout the planet.

The world economy did not have time to recover from a trade conflict between the United States and China, as it is already threatened by a new scourge. The fact that in November, global trade fell by 0.6% in monthly terms and 1.1% in annual terms does not please the bulls in EUR/USD.

The problems of the export-oriented economy of the eurozone do not end there. The United States, under the threat of imposing duties on importing cars from the European Union, may demand that American companies expand their access to the European agricultural market. Moreover, Washington could avenge Brussels on its carbon tax. Turning a blind eye to environmental issues, the White House regards the introduction of tariffs by other states as a manifestation of protectionism.

Meanwhile, the US economy is still on its feet. According to IHS Markit, the US composite purchasing managers index reached a ten-month high in January due to increased business activity in the services sector. The data on PMI in the non-manufacturing sector of the eurozone, on the contrary, disappointed, which makes it possible for the EUR/USD bears to win back the divergence factor in US and EU economic growth.

The external background is extremely unfavorable for the euro bulls, so the main currency pair's decline to seven-week lows appears quite logical. Neither the January meeting of the ECB's Governing Session, nor the data on European business activity, could provide adequate support to fans of the euro. Whether the Federal Reserve wants to do this, a meeting of which, along with releases on US and European GDP for the fourth quarter, is one of the key events of this week, is unknown.

The goal of EUR/USD bears at 1.1000 is just around the corner, and then support at 1.0960 will appear on the horizon. As for the bulls, their immediate task is to overcome the powerful resistance of 1.1065, then the resistance of 1.1100 and 1.1175.

*The market analysis posted here is meant to increase your awareness, but not to give instructions to make a trade.

Analysis are provided byInstaForex.

Best regards, PR Manager / Learn more about InstaForex Company at http://instaforex.com

Re: InstaForex Analysis

USD/JPY approaching resistance, potential drop !

https://forex-images.ifxdb.com/userfiles/20200129/analytics5e310d6bbbfb2.png   


Trading Recommendation Entry: 109.31 Reason for Entry: Horizontal overlap resistance Take Profit :108.73

Reason for Take Profit: Horizontal swing low supportStop Loss: 109.79

Reason for Stop loss: Horizontal pullback resistance


*The market analysis posted here is meant to increase your awareness, but not to give instructions to make a trade.

Best Regards,PR Manager
InstaForex Companies Group

Re: InstaForex Analysis

Forecast for GBP/USD on January 30, 2020

GBP/USD
Yesterday, the British pound, in anticipation of today's decision by the Bank of England on monetary policy, traded in a small range, which only strengthened the technical signs of an upward price movement. On the daily chart, the signal line of the Marlin oscillator outlined a reversal up and thereby formed a wedge with the same probability of exiting from it in any direction.

https://forex-images.ifxdb.com/userfiles/20200130/analytics5e3255886de11.png

To break this triangle down, the price needs to gain a foothold at the Fibonacci level of 161.8% (1.2968), the target of the movement will be the Fibonacci level of 138.2% at the price of 1.2820. If the triangle breaks up, prices will go above 1.3070. In this case, the MACD line will be the target level, located near the Fibonacci level of 200.0%, near the price level of 1.3220. Moreover, growth may not stop there.

https://forex-images.ifxdb.com/userfiles/20200130/analytics5e32559dde866.png

On the four-hour chart, the signal level 1.3070 corresponds to the MACD line. This strengthens the significance of the level. The driver of the movement, obviously, will be the outcome of the Bank of England meeting. Changes in monetary policy are unlikely to be, as the economic situation in the UK remains neutral, and today's meeting will be Mark Carney's final for the central bank, his term of office will expire. The main intrigue in the distribution of votes for maintaining the rate. The consensus forecast is 3-6 versus 2-7 at the last meeting, but the forecast range itself is wider, up to 4-5, and it is precisely such a voting result that can send the pound to growth much higher than the first target 1.3220.

Analysis are provided byInstaForex.

Best regards, PR Manager / Learn more about InstaForex Company at http://instaforex.com

Re: InstaForex Analysis

Forecast for GBP/USD on January 31, 2020

GBP/USD
Yesterday's meeting of the Bank of England brought a pleasant surprise for the pound - 7 members of the monetary policy committee spoke out for maintaining the rate against the expectation of 6 or even 5 members. The pound grew by 75 points due to this. On the daily chart, the signal line of the Marlin oscillator entered the growth zone and goes above the upper boundary of its own wedge. Price above the balance line. The growth target of 1.3220 is the area of accumulation of the Fibonacci level of 200.0% with the indicator line of MACD.

https://forex-images.ifxdb.com/userfiles/20200131/analytics5e33a7b7dd06b.png

On a four-hour chart, the price is higher than both indicator lines - balance sheet and MACD, Marlin in the trend growth zone. We look forward to continued growth.

https://forex-images.ifxdb.com/userfiles/20200131/analytics5e33a7ccd44d2.png

*The market analysis posted here is meant to increase your awareness, but not to give instructions to make a trade.

Analysis are provided byInstaForex.

Best regards, PR Manager / Learn more about InstaForex Company at http://instaforex.com

Re: InstaForex Analysis

Forecast for GBP/USD on February 3, 2020

GBP/USD
The pound rose 110 points on Friday amid the general weakening of the dollar. Growth stopped exactly at the Fibonacci level of 200.0%. Today the market opened with a window (gap) down, which becomes a sign of another upward price surge for its closure and likely testing the MACD line (1.3227). But growth may not end there. Overcoming the MACD line opens the target at the top of December 31, 1.3284, then growth to the Fibonacci level of 223.6% at the price of 1.3352 may follow.

https://forex-images.ifxdb.com/userfiles/20200203/analytics5e379c410b554.png

A sign of such strong potential growth is the upward movement of the Marlin oscillator signal line from its own wedge-shaped structure.

https://forex-images.ifxdb.com/userfiles/20200203/analytics5e379c565e926.png

A gap in the quote at the opening on the technical side can be a sign of a reversal, since the four-hour chart may form an oscillator divergence when the window is closed. In this case, leaving the triangle on daily may be a false signal.

So, for the British pound, it remains to wait for either a reversal pattern to form or price consolidation above 1.3227.

*The market analysis posted here is meant to increase your awareness, but not to give instructions to make a trade.

Analysis are provided byInstaForex.

Best regards, PR Manager / Learn more about InstaForex Company at http://instaforex.com

Re: InstaForex Analysis

Overview of the EUR/USD pair. February 4. Euro has chance at growth, but with no macroeconomic support

4-hour timeframe

https://forex-images.ifxdb.com/userfiles/20200204/analytics5e38d45719fb7.png

Technical details:
Higher linear regression channel: direction - up.
Lower linear regression channel: downward direction.
Moving average (20; smoothed) - up.
CCI: 78.3586

The first trading day of the week passed in a corrective movement, however, the EUR/USD pair worked out a moving average line, but failed to gain a foothold below it, which saves the bulls chances of a new upward trend. In principle, following the euro's two day growth, the pair has been corrected as expected and now technical factors allow us to count on the resumption of the upward movement. However, in addition to technical factors, there are also fundamental, as well as macroeconomic ones. In brief, I recall that the fundamental factors remain on the side of the US currency for the following reasons: a stronger US economy, a more hawkish monetary policy by the Federal Reserve, the same pace of slowdown in the economies of the United States and the European Union, as well as the same signs of economic recovery. Macroeconomic factors are also in favor of the dollar this week so far: US manufacturing activity indices have increased and left the red zone below 50.0, business activity indices in the manufacturing sector of the EU have shown low growth, but most of them remained in the recession zone. Thus, at the moment, we have a certain conflict between fundamental and technical factors, and we believe that the upward movement will not be strong and long.

Only minor macroeconomic publications are planned in the EU and US on Tuesday, February 4. For example, the producer price index for December will be released in the EU, which, according to experts, will decrease by 0.7% y/y. Production orders for December will be published in the US, with a forecast of +1.1% m/m. However, it is unlikely that traders will react to any of these reports. We can only note the value of the producer price index, as it can affect the value of inflation. We already said in the final article for February 3 on the EUR/USD pair that Donald Trump can already be considered acquitted. Democrats were not able to attract even more witnesses to the case, but managed to stretch the entire process of considering it in the Senate as much as possible. In principle, the fact that the Senate refuses to impeach Trump was known with a probability of 99% from the very beginning. We have already said that the essence of the entire trial for the Democrats was the trial itself. The longer it lasts, the longer Trump is exposed in an unsightly light for himself before the electorate, which already in November 2020 will have to make a choice. Thus, we can only wait for the official results of the Senate vote on Wednesday and put a bullet in this matter. As for Trump's ratings, many agencies note that at this time they are at their highest values. But will these values be enough for the American people to choose an odious president for the second time? Social surveys say that 52% of Americans believe that Trump really violated the law by blocking military assistance to Ukraine, and also urging Vladimir Zelensky to launch an investigation into the activities of the Biden Democrats in Ukraine. 53% of Americans believe that the president did obstruct Congressional work by refusing to cooperate with the investigation of his own impeachment case. Thus, more than half of the electorate is now opposing Trump.

Trump himself feels calm, has stopped criticizing the Fed and Jerome Powell, has stopped scribbling daily opuses on Twitter about the "witch hunt" and in his exceptional style has managed to call Michael Bloomberg, one of the main Democratic presidential contenders, "short." "It's all right," Trump said, "you can be short. He (Michael Bloomberg) wants the box to stand on during the debate, but there is nothing wrong with that." Naturally, Bloomberg's spokesman Julie Wood immediately reacted, saying the US president was lying again. "He's lying all the time, he's a pathological liar," said Wood.

From a technical point of view, we are now waiting for the price to rebound from the moving and resumption of the upward movement with the update of the previous peak price. The macroeconomic background will be extremely weak tomorrow, so nothing should prevent the influence of technical factors on the pair's movement. In the event of consolidating the euro/dollar quotes below the moving average, the trend will change again to a downward trend.

https://forex-images.ifxdb.com/userfiles/20200204/analytics5e38d46cbb2f2.png

The average volatility of the EUR/USD currency pair has increased due to trading on Friday and Monday to 47 points per day. Now this value is already average. Thus, on the second trading day of the week, we expect movement between the boundaries of the volatility band at 1.1012 and 1.1106. The steam will tend to lean towards the development of the upper boundary.

Nearest support levels: S1 - 1.1047
S2 - 1,1017
S3 - 1,0986
The nearest resistance levels:
R1 - 1,1078
R2 - 1,1108
R3 - 1,1139

Trading recommendations:
The euro/dollar began to adjust. Thus, purchases of the European currency with goals of 1.1078 and 1.1106 are relevant now, but we recommend that you wait for the correction to complete and only then should you start buying. It is recommended to return to selling the EUR/USD pair no earlier than consolidating the price below the moving average line, which will change the current trend to a downward trend, with targets at 1.1017 and 1.0986.

In addition to the technical picture, fundamental data and the time of their release should also be taken into account.
Explanation of illustrations:
The highest linear regression channel is the blue unidirectional lines.
The smallest linear regression channel is the purple unidirectional lines.
CCI - blue line in the indicator window.
Moving average (20; smoothed) - a blue line on the price chart.
Murray levels - multi-colored horizontal stripes.
Heiken Ashi is an indicator that colors bars in blue or purple. Possible price movements:
Red and green arrows.

*The market analysis posted here is meant to increase your awareness, but not to give instructions to make a trade.

Analysis are provided byInstaForex.

Best regards, PR Manager / Learn more about InstaForex Company at http://instaforex.com

Re: InstaForex Analysis

USD/CAD control zones for February 5, 2020

The test of the weekly control zone 1.3292-1.3276 occurred at the beginning of the week. This made the fixing of the previously opened purchases possible. Meanwhile, the reversal pattern has not yet been formed, so it is quite early to completely exit the long position. The probability of continued growth is still high.

https://forex-images.ifxdb.com/userfiles/20200205/analytics5e3a30fa6a63d.png

Sales from the current levels are not profitable, as the probability of testing the November high still remains above 70%. On the other hand, an alternative corrective model will be developed if the "false break" pattern of the weekly high is formed today. This will allow sales to be considered in the nearest support zone tomorrow.

https://forex-images.ifxdb.com/userfiles/20200205/analytics5e3a327fdba47.png

Daily CZ - daily control zone. The zone formed by important data from the futures market, which changes several times a year.

Weekly CZ - weekly control zone. The zone formed by important marks of the futures market, which changes several times a year.

Monthly CZ - monthly control zone. The zone that reflects the average volatility over the past year.

*The market analysis posted here is meant to increase your awareness, but not to give instructions to make a trade.

Analysis are provided byInstaForex.

Best regards, PR Manager / Learn more about InstaForex Company at http://instaforex.com

Re: InstaForex Analysis

Forecast for EUR/USD on February 6, 2020

Yesterday's US data on business activity in the non-manufacturing sector for January showed consistently high readings: the service PMI from Markit in the final assessment was raised to 53.4 from 53.2, and the ISM Non-Manufacturing PMI was 55.5 against 55.0 in December. This is a good sign of the stability of the American economy during the development of the coronavirus. The economic indicators of the Asia-Pacific countries are deteriorating, and the dollar is already becoming unshakeable. It is important to note that the strengthening of the dollar began on February 3, the day of the start of the presidential election campaign in the United States. We don't think it's a coincidence. During his time in office, Trump has repeatedly changed his position on the strength of the national currency, but the facts show one thing – the dollar has steadily strengthened over the past two years. We believe that now Donald Trump will be more specific.

https://forex-images.ifxdb.com/userfiles/20200206/analytics5e3b7fc3a3e79.png

The euro has completed its immediate task - it is fixed under the embedded line of the price channel on the daily chart. Now the pair's immediate target is 1.0925 – the lows of September 12 and 3, 2019. The second target is the minimum of October 1 at 1.0880.

https://forex-images.ifxdb.com/userfiles/20200206/analytics5e3b7fdd1ea00.png

On the four-hour chart, the price is fixed under the indicator lines, and the Marlin oscillator is in the negative trend zone. The decline continues.


*The market analysis posted here is meant to increase your awareness, but not to give instructions to make a trade.

Best Regards,PR Manager
InstaForex Companies Group

Re: InstaForex Analysis

Forecast for EUR/USD on February 7, 2020

EUR/USD
Yesterday, the euro managed to gain a foothold under the enclosed line of the price channel, which originates from the top of 2008. On the daily chart, the price also went under the Fibonacci reaction level of 138.2%.

https://forex-images.ifxdb.com/userfiles/20200207/analytics5e3cd33a79835.png

Yesterday's publication of industrial orders in Germany for December showed a decrease of 2.1% against expectations of growth of 0.6%. In the US, the weekly report on applications for unemployment benefits showed 202 thousand such applications against the forecast of 215 thousand and 217 thousand a week earlier. The average monthly value of this indicator is 211.2 thousand. Taking into account the excellent data on employment in the private sector from ADP of 291 thousand and good employment sub-indexes in the ISM structure – 46.6 in the manufacturing sector and 53.1 in the non-manufacturing sector, there is a high chance that today's data on new jobs in the non-agricultural sector for January will come out better than the forecast. The forecast for the Non-Farm employment change is 163 thousand against 145 thousand in December. The forecast for wage growth is 0.3% compared to 0.1% a month earlier.

https://forex-images.ifxdb.com/userfiles/20200207/analytics5e3cd35a29e2b.png

On a four-hour chart, the price drops below the indicator lines, and the Marlin oscillator goes deeper into the negative trend zone. The decline targets are visible on the daily chart: 1.0925 - minimum on September 3 and 12, 2019, and 1.0880 - minimum on October 1.

*The market analysis posted here is meant to increase your awareness, but not to give instructions to make a trade.

Analysis are provided byInstaForex.

Best regards, PR Manager / Learn more about InstaForex Company at http://instaforex.com

Re: InstaForex Analysis

Forecast for EUR/USD on February 10, 2020

EUR/USD

Friday's data on employment in the United States exceeded even optimistic forecasts; 225,000 jobs were created outside the agricultural sector in January against expectations of 163,000, the December figure was revised up to 147,000 from 145,000, the November Non-Farm Employment Change increased by 5,000, and the average hourly wage increased for the month by 0.2%. At the same time, the volume of consumer lending almost doubled – from 11.8 billion dollars to 22.1 billion. As a result, the euro fell by 36 points.

The reduction targets remain: 1.0925 - minimum on September 3 and 12, 2019, and 1.0880 - minimum on October 1.

https://forex-images.ifxdb.com/userfiles/20200210/analytics5e40c6d9c9b10.png

On the four-hour chart, the signal line of the leading Marlin oscillator is directed upwards, which indicates that the indicator is likely to discharge and consolidate the price before a further decline.

https://forex-images.ifxdb.com/userfiles/20200210/analytics5e40c6f3ce885.png


*The market analysis posted here is meant to increase your awareness, but not to give instructions to make a trade.

Best Regards,PR Manager
InstaForex Companies Group

Re: InstaForex Analysis

Overview of the GBP/USD pair. February 11. Today could be a black day for the pound

4-hour timeframe

https://forex-images.ifxdb.com/userfiles/20200211/analytics5e422502eae85.png

Technical details:
Higher linear regression channel: direction - up.
Lower linear regression channel: downward direction.
Moving average (20; smoothed) - down.
CCI: -79.5400
The GBP/USD currency pair continues to adjust on February 11. After the pair worked the Murray level "3/8" - 1.2878, there was a rebound, which provoked the beginning of the correction. Also there weren't any important publications or speeches by top officials in the United Kingdom and the United States on the first trading day of the week. Thus, traders were deprived of fundamental recharge on February 10. Therefore, Monday was, in principle, a good option for a correction, although we expected that the downward movement will continue. However, the Heiken Ashi indicator turned up and signaled a temporary break in the downward movement. It should also be noted that on Tuesday, that is, today, information from the UK that is of a very important degree of significance will come from the UK. Therefore, before such an important block of macroeconomic data, traders recorded part of the profit on short positions previously opened.

Now we turn directly to macroeconomic statistics. The most significant indicator, of course, will be the indicator of GDP. However, you should immediately make a reservation that tomorrow there will be at least four variations of this indicator, moreover, with different values. For example, GDP for December will be published, that is, in monthly terms with a forecast of +0.2%. An estimate of GDP growth rates from NIESR for January will also be published with a forecast of +0.2%. Preliminary data on Gross Domestic Product for the fourth quarter in annual and quarterly terms with forecasts of +0.8% and +0.0% from the National Statistics Office will be published. We believe that it is the last two indicators that are the most significant. Take a look at the chart.

https://forex-images.ifxdb.com/userfiles/20200211/analytics5e42251816e9f.png

Over the past three years, UK GDP has shown even more or less strong GDP growth. That is, each quarter there was an increase in comparison with the same quarter of the previous year by no less than 1.1%. 1.1% is, of course, not much, however. GDP forecasts for the fourth quarter of 2019 indicate that growth rates may decline to 0.8% y/y. That is, for the first time in the last three years (and in fact for the first time since 2010), the growth rate will be less than 1% y/y. This is what we have repeatedly said when we covered the problem of a slow down in Great Britain's economy. The economy continues to lose money, problems associated with Brexit and the uncertainty surrounding the trade deal with the European Union continue to negatively affect the business climate and the desire of entrepreneurs to invest. Moreover, certain companies are leaving the UK, some are cutting production on its territory, some are moving their financial centers outside of Great Britain. Of course, all this negatively affects the economy.

https://forex-images.ifxdb.com/userfiles/20200211/analytics5e42261988e90.png

The next indicator is industrial production. Here things are even worse than with GDP. In annual terms, industrial production has been declining for a year and a half almost every month. Tomorrow it is expected that this indicator will lose its regular 0.8% in annual terms, and will add 0.3% in monthly terms. It is clear that even if the annual indicator is slightly better than expected, it is still unlikely to get out of the negative zone. Thus, both main indicators of tomorrow should significantly exceed forecast values in order to trigger purchases of the British pound.

https://forex-images.ifxdb.com/userfiles/20200211/analytics5e42262e923fc.png

We would also like to draw the attention of traders to the indicator of the volume of commercial investments, which, although not as important as the first two indicators, still reflects the essence of what is happening. Judging by the data for the last 12 months, investment volumes are also more often declining than growing. For tomorrow, the forecast is -1.3% in the fourth quarter on an annualized basis. And what do we have in the end? The three most significant indicators for the UK economy over the past year and a half have only been doing so, which are declining. For tomorrow, all three indicators have negative forecasts. What growth of the British pound in the long run can be discussed with such macroeconomic statistics? We are still wondering why the Bank of England didn't soften monetary policy at the last meeting and where did it see "economic recovery after the December elections"? We notice only an even greater reduction in key indicators. And again, it is worth noting that all this happens before the official breakdown of all ties between London and Brussels, which is scheduled for December 31, 2020. That is, in fact, Brexit has not even begun. Now only preparations are underway for him.

From a technical point of view, all indicators show a downward movement, except for the higher linear regression channel. Thus, the overall trading strategy remains the same - downward trading, especially since there are not even any corrections now.

https://forex-images.ifxdb.com/userfiles/20200211/analytics5e4226e28f6d2.png

The average volatility of the pound/dollar pair has dropped to 91 points over the past five days, and the volatility illustration clearly shows that in the last 6 days it has been reduced. According to the current level of volatility, the working channel on February 11 will be limited by the levels of 1.2821 and 1.3003. The resumption of the downward movement would be very logical on Tuesday, given the fundamental background. A turn of the Heiken Ashi indicator down will indicate the completion of a round of corrective movement.

Nearest support levels:
S1 - 1.2878
S2 - 1.2817
S3 - 1.2756

The nearest resistance levels:
R1 - 1.2939
R2 - 1,3000
R3 - 1.3062

Trading recommendations:
GBP/USD is adjusted.
Thus, traders are now advised to wait until the correction is completed and resume selling the pound with goals of 1.2878 and 1.2821. It is recommended to consider purchases of the British currency after the price is consolidated above the moving average line with the first objectives of 1.3062 and 1.3123.

In addition to the technical picture, fundamental data and the time of their release should also be taken into account.
Explanation of illustrations:
The highest linear regression channel is the blue unidirectional lines.
The smallest linear channel is the purple unidirectional lines.
CCI - blue line in the indicator regression window.
Moving average (20; smoothed) - a blue line on the price chart.
Murray levels - multi-colored horizontal stripes.
Heiken Ashi is an indicator that colors bars in blue or purple.
Possible price movements:
Red and green arrows.

*The market analysis posted here is meant to increase your awareness, but not to give instructions to make a trade.

Analysis are provided byInstaForex.

Best regards, PR Manager / Learn more about InstaForex Company at http://instaforex.com

Re: InstaForex Analysis

Comprehensive analysis of movement options of #USDX vs AUD/USD vs USD/CAD vs NZD/USD (H4) on February 12

Minuette (H4)
Let's consider what will happen to commodity currency instruments from February 12, 2020. So, here's a comprehensive analysis of the development options for the movement #USDX vs AUD / USD vs USD / CAD vs NZD / USD.

US dollar index
The movement of the #USDX dollar index from February 12, 2020 will be determined by developing and the direction of breakdown of the boundaries of the equilibrium zone (98.63 - 98.83 - 99.05) of the Minuette operational scale forks. We look at the movement markings inside this zone on the animated chart.

In case of breakdown of the lower boundary of ISL61.8 (support level of 98.63) of the equilibrium zone of the Minuette operational scale forks, it will lead to the development of the downward movement of the dollar index and be directed to the boundaries of the equilibrium zone (98.20 - 97.92 - 97.64) of the Minuette operational scale forks.

On the contrary, If the upper boundary of ISL61.8 (resistance level of 98.40) of the equilibrium zone of the Minuette operational scale forks and the final line FSL (resistance level of 99.12) of the Minuette operational scale forks are broken down, the upward movement #USDX can continue to the warning line UWL38.2 (99.60) of the Minuette operational scale forks and FSL Minuette end line (99.75). The markup of #USDX movement options from February 12, 2020 is shown on the animated chart

https://forex-images.ifxdb.com/userfiles/20200211/analytics5e42dccb7f677.jpg

Australian dollar vs US dollar

The development and direction of the breakdown of the boundaries of 1/2 Median Line channel (0.6699 - 0.6715 - 0.6731) of the Minuette operational scale forks will determine the development of the movement of the Australian dollar AUD / USD from February 12, 2020. The marking the development of the above levels are shown on the animated chart.

The breakdown of the upper boundary of the 1/2 Median Line Minuette channel - resistance level of 0.6731 will lead to the Australian dollar reaching the equilibrium zone (0.6739 - 0.6764 - 0.6787) of the Minuette operational scale forks with the prospect of further development of the AUD / USD movement in the 1/2 Median Line channel (0.6780 - 0.6830 - 0.9875) of the Minuette operational scale forks.

A sequential breakdown of the lower boundary of the 1/2 Median Line channel of the Minuette operational scale forks - support level of 0.6699 and the 1/2 Median Line Minuette 0.6690 will determine the continuation of the development of the downward movement of the Australian dollar towards the goals:
- the initial SSL Minuette line (0.6655);
- control line LTL Minuette (0.6644);
- lower boundary ISL61.8 (0.6625) equilibrium zone of the Minuette operational scale forks;
with the prospect of reaching warning lines - LWL38.2 (0.6615) and LWL61.8 (0.6590) of the Minuette operational scale forks.
We look at the layout of the AUD / USD movement options from February 12, 2020 on the animated chart.

https://forex-images.ifxdb.com/userfiles/20200211/analytics5e42dcb181953.jpg

US dollar vs Canadian dollar

The development of the movement of the Canadian dollar USD / CAD from February 12, 2020 will continue to be determined by developing the boundaries of the equilibrium zone (1.3225 - 1.3276 -1.3333) of the Minuette operational scale forks. We look at the movement markings inside this zone on the animated chart.

The breakdown of the lower boundary of ISL38.2 (support level of 1.3225) of the equilibrium zone of the Minuette operational scale forks will continue the development of the downward movement of the Canadian dollar towards the goals:
- lower boundary of ISL61.8 (1.3200) equilibrium zones of the Minuette operational scale forks;
- final Schiff Line Minuette (1.3185);
with the prospect of reaching the final line of the FSL Minuette (1.3115).
On the other hand, a combined breakdown of the upper boundary of the ISL61.8 (resistance level of 1.3333) equilibrium zone of the Minuette operational scale forks and the control line UTL Minuette (1.3345) will make the achievement of USD / CAD warning lines - UWL23.6 (1.3365) - UWL38.2 (1.3390) - UWL61.8 (1.3410) and UWL100.0 (1.3455) of the Minuette operational scale forks, relevant.
We look at the markup of USD / CAD movement options from February 12, 2020 on the animated chart.

https://forex-images.ifxdb.com/userfiles/20200211/analytics5e42dc91826a0.jpg

New Zealand dollar vs US dollar

The development of the movement of the New Zealand dollar NZD / USD from February 12, 2020 will depend on the development and direction of the breakdown of the range :

resistance level of 0.6390 (the lower boundary of the 1/2 Median Line channel of the Minuette operational scale forks);
support level of 0.6370 (control line LTL of the Minuette operational scale forks).

In case of breakdown of the resistance level of 0.6390, the NZD / USD movement will continue in the 1/2 Median Line Minuette channel (0.6390 - 0.6460 - 0.6525), and if the upper boundary (0.6525) of this channel is broken, the price of the instrument will continue to move in the equilibrium zone (0.6525 - 0.6575 - 0.6622) of the Minuette operational scale forks.

Alternatively, in case that the breakdown of the support level of 0.6420 takes place on the control line of the LTL of the Minuette operational scale forks, then it will be relevant to reach the New Zealand dollar reaching the boundaries of the equilibrium zone (0.6350 - 0.6255 - 0.6155) of the Minuette operational scale forks.

We look at the layout of the NZD / USD movement options from February 12, 2020 on the animated chart.

https://forex-images.ifxdb.com/userfiles/20200211/analytics5e42dc726ab22.jpg

The review is made without taking into account the news background. Thus, the opening of trading sessions of major financial centers does not serve as a guide to action (placing orders "sell" or "buy").

The formula for calculating the dollar index:

USDX = 50.14348112 * USDEUR0.576 * USDJPY0.136 * USDGBP0.119 * USDCAD0.091 * USDSEK0.042 * USDCHF0.036.

where the power coefficients correspond to the weights of the currencies in the basket:

Euro - 57.6%;
Yen - 13.6%;
Pound Sterling - 11.9%;
Canadian dollar - 9.1%;
Swedish krona - 4.2%;
Swiss franc - 3.6%.

The first coefficient in the formula leads the index to 100 at the starting date - March 1973, when the main currencies began to be freely quoted relative to each other.

Analysis are provided byInstaForex.

Best regards, PR Manager / Learn more about InstaForex Company at http://instaforex.com

Re: InstaForex Analysis

Forecast for EUR/USD on February 13, 2020

EUR/USD
Yesterday's publication of data on industrial production in the eurozone was worse than expected - the December decline was-2.1% versus the expected -1.8%. In Europe, they talked about a potentially even greater economic failure due to the epidemic in China. But China itself predicts that the epidemic will decline in April. The euro lost 40 points on Wednesday. The 1.0880 target was fulfilled, there was a consolidation under the lower TF. The following goals are determined by Fibonacci levels: 161.8% - 1.0840, 200.0% - 1.0745.

https://forex-images.ifxdb.com/userfiles/20200213/analytics5e44c1fcb9e0f.png

A convergence is outlined on the four-hour chart on the Marlin Oscillator, this is a sign of a slight correction before a further decline. Consolidation will likely take place before the level of 1.0905.

https://forex-images.ifxdb.com/userfiles/20200213/analytics5e44c2126bfd1.png

*The market analysis posted here is meant to increase your awareness, but not to give instructions to make a trade.

Analysis are provided byInstaForex.

Best regards, PR Manager / Learn more about InstaForex Company at http://instaforex.com

Re: InstaForex Analysis

EURUSD: euro not pleased with the European Commission's future outlook for eurozone inflation. US inflation report will return the market to its place

The European currency was not very happy with the fact that consumer prices in Germany fell again in January, having justified all the forecasts of analysts, who put on another decline. The main decline in prices was due to a sharp drop in demand for tourism services, and there are reasons for this. According to the statistics agency Destatis, the final CPI of Germany in January 2020 fell by 0.6% compared to December and increased by 1.7% compared to the same period of the previous year. The data fully coincided with the expectations of economists. As for inflation harmonized by EU standards, the index decreased by 0.8% in January compared to December and increased by 1.6% compared to January 2019.

https://forex-images.ifxdb.com/userfiles/20200214/analytics5e45e38ed5df8.jpg

As I noted above, the main reason is the sharp decline in prices for travel packages that occurred due to the outbreak of coronavirus in China. After a series of bad indicators released this and that week on the eurozone countries, many economists no longer consider future forecasts for Europe to be too optimistic. However, today, in the first half of the day, after a breakdown of the year's low in the region of 1.0865, the European Commission kept a report from a larger fall of the euro, in which a number of experts expected to see revised forecasts for economic growth and inflation.

https://forex-images.ifxdb.com/userfiles/20200214/analytics5e45e3ae2c1d8.jpg

Let me remind you that the European Commission's previous forecast was presented in November 2019.

So, in today's report, the European Commission continues to forecast eurozone GDP growth in 2020 at 1.2% and at a similar level in 2021. But the inflation forecast, on the contrary, was revised for the better. Now economists expect that inflation in the eurozone will be at 1.3% in 2020 against the previous forecast of 1.2%. For 2021, growth is expected at 1.4% against the previous forecast of 1.3%.

https://forex-images.ifxdb.com/userfiles/20200214/analytics5e45e3bfed6b3.jpg

So far, the main concern that will negatively affect the eurozone economy is coronavirus, which represents a new bearish risk. There is also a fairly high degree of uncertainty surrounding US trade policy, which is an obstacle to improving sentiment. And if the trade agreement between the US and China has somewhat reduced the bearish risks, what will happen when the White House again raises the issue of duties with the eurozone is still a question.

The European Commission expects that economic growth will remain stable, and all emphasis is placed on domestic demand, while easing fiscal policies may support the economy in the future. The report also called for eurozone countries to pursue structural reforms aimed at boosting economic growth.

As for the technical picture of the EURUSD pair, buyers of risky assets continue to actively fight for the level of 1.0865, having missed that on inflation data in the US, one can only hope for lows in the areas of 1.0840 and 1.0800. If the scenario of profit taking on short positions by large players justifies itself after the data, then the upward correction will be limited by the first intermediate resistance level of 1.0890, but larger highs are seen in the areas of 1.0925 and 1.0950.

*The market analysis posted here is meant to increase your awareness, but not to give instructions to make a trade.

Analysis are provided byInstaForex.

Best regards, PR Manager / Learn more about InstaForex Company at http://instaforex.com

Re: InstaForex Analysis

GBP/USD. Preview of the new week. Pound to closely monitor inflation and business activity in the industry

24-hour timeframe

As I noted above, the main reason is the sharp decline in prices for travel packages that occurred due to the outbreak of coronavirus in China. After a series of bad indicators released this and that week on the eurozone countries, many economists no longer consider future forecasts for Europe to be too optimistic. However, today, in the first half of the day, after a breakdown of the year's low in the region of 1.0865, the European Commission kept a report from a larger fall of the euro, in which a number of experts expected to see revised forecasts for economic growth and inflation.

https://forex-images.ifxdb.com/userfiles/20200217/analytics5e49db9fbdb0a.png

The British pound began to form a new downward trend, but a turn up and a round of upward correction began this trading week against the current weakest downward trend. Bollinger Bands are directed down, which so far retains the likelihood of a resumption of a downward trend. Also, the pound/dollar pair has not yet been able to cross the Kijun-sen line on the 24-hour chart, although it is very close to it. As we have already said, this week traders reacted not to macroeconomic statistics, but to political news from the British Parliament. And we believe that the pound once again shows growth when there is no reason at all for this. Over the past two years, this situation has been repeated regularly, the pound regularly rises in price on rumors that are not confirmed, on expectations, on various kinds of political messages. But macroeconomic statistics are just regularly ignored, as it was this week. The upcoming week will be much more interesting for the GBP/USD currency pair than for the EUR / USD pair, since there will be a sufficient amount of important data from Great Britain.

Monday will be completely empty in terms of macroeconomic statistics. There is absolutely nothing to pay attention to. President's Day will be celebrated in the United States on Monday. Therefore, you can proceed to Tuesday. On this day, the UK will publish average wage for December with and without bonuses, the unemployment rate for December, as well as the number of applications for unemployment benefits. No major changes in these indicators are expected. The unemployment rate is likely to remain at a fairly low level of 3.8%, the number of new applications for unemployment benefits will amount to 22,600, and the growth rate of wages can only slightly slow down. Thus, everything will depend on how much the real values of the indicators differ from the predicted ones.

A much more important consumer price index in the UK will be published on Wednesday, which, according to experts, could accelerate from 1.3% y/y to values ranging from 1.4% - 1.6% y/y. However, in monthly terms, inflation is likely to slow down by 0.5% - 0.6%, which, in fact, eliminates almost any positive effect from the annual value. Recall that the annual value is calculated relative to the same month last year. Thus, it turns out that the annual value can be at least +5%, but if negative inflation is recorded in monthly terms, this will mean that it will continue to slow down, and in the case of Great Britain, deflation can already be observed in monthly terms.

Great Britain will release retail sales reports for January, as well as a CBI report on changes in industrial orders. It is expected that the first indicator will show an increase of 0.4% in annual terms and in monthly terms. This is a good increase for the monthly, while it is very weak for the annual. The second industrial order indicator, presented by the Confederation of British Industrialists, is expected to remain in the negative zone, since the British industry continues to experience serious problems.

Britain is set to publish indices of business activity in the fields of services and production in the last trading week of the next week. In recent months, the index in the manufacturing sector has risen and returned to the area of 50.0 and higher, however it may again fall to the area below the key level of 50 by the end of February. According to forecasts, this indicator will decrease to the value 49.6 in February. As for the service sector, everything is more stable and positive here - forecasts for February are 53.2 - 53.4 with the previous value of 53.9. As you can see, a decline is expected everywhere.

In general, we believe that the British currency will have no supporting macroeconomic factors next week. Having studied all the macroeconomic reports, we came to the conclusion that most of them could fail again. Of course, special attention should be paid to inflation, if it accelerates, this can cause a wave of purchases of the British currency, but in general we do not see the prerequisites for the UK economy to accelerate and macroeconomic indicators to recover. From time to time, individual indicators grow (for example, the index of business activity in industry), but this looks like a correction, after which a new decline will inevitably follow. Thus, the Bank of England has many questions about the current state of the British economy, as well as to monetary policy, which, in our opinion, should have already been softened.

Trading recommendations:
The pound/dollar pair started an upward correction on the 24-hour timeframe. Thus, at the moment, for the 24-hour timeframe, it is recommended that you aim for 1.2838 and 1.2724 for the pound, if the bulls fail to overcome the Kijun-sen critical line. Shorts are still more relevant on the 4-hour timeframe, but there you should now wait until a dead cross forms before resuming to trade down.

Explanation of the illustration:
Ichimoku indicator:
Tenkan-sen is the red line.
Kijun-sen is the blue line.
Senkou Span A - light brown dotted line.
Senkou Span B - light purple dashed line.
Chikou Span - green line.
Bollinger Bands Indicator:
3 yellow lines.
MACD indicator:
line and bar graph with white bars in the indicators window.

*The market analysis posted here is meant to increase your awareness, but not to give instructions to make a trade.

Analysis are provided byInstaForex.

Best regards, PR Manager / Learn more about InstaForex Company at http://instaforex.com

Posts: 476 to 500 of 1,547

Pages Previous 1 18 19 20 21 22 62 Next

You must login or register to post a reply

Forex Software → Market Analysis → InstaForex Analysis

Similar topics in this forum