Re: Forex Technical Analysis & Forecast by RoboForex
Ichimoku Cloud Analysis 20.11.2019 (AUDUSD, NZDUSD, USDCAD)
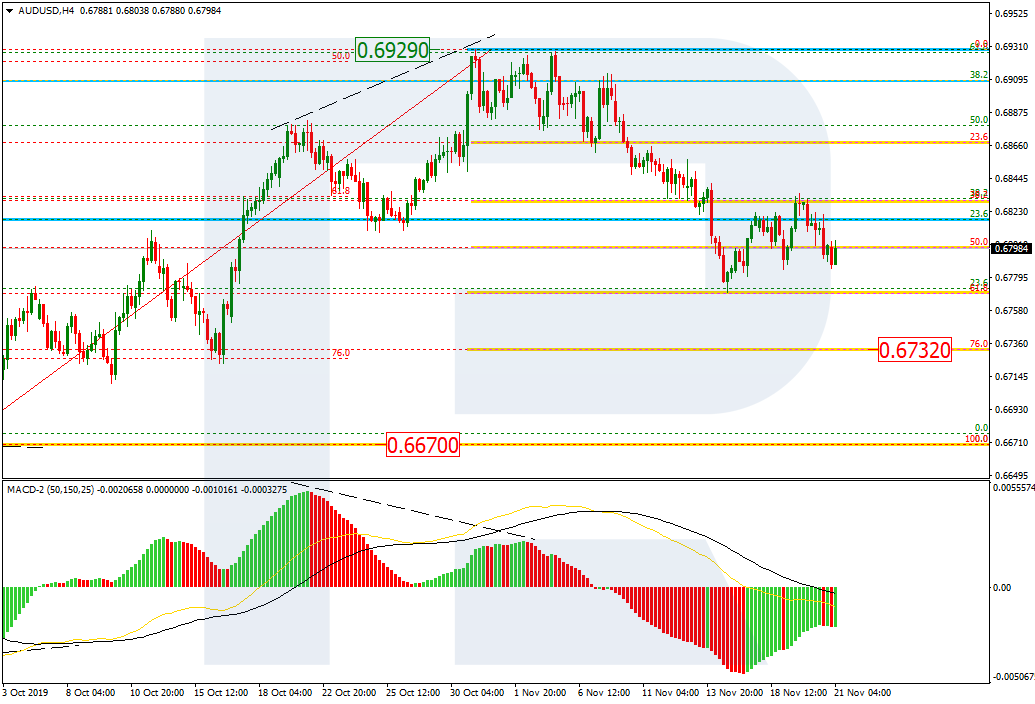
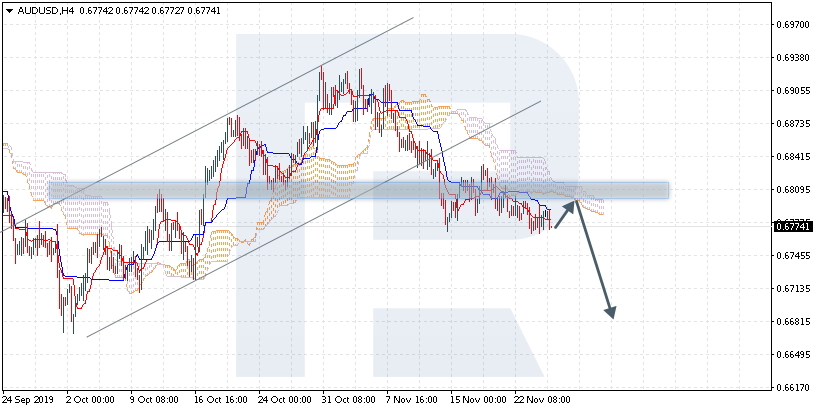
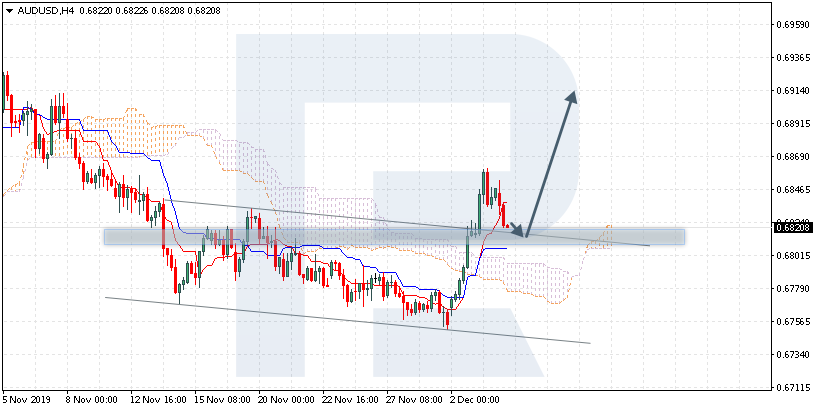
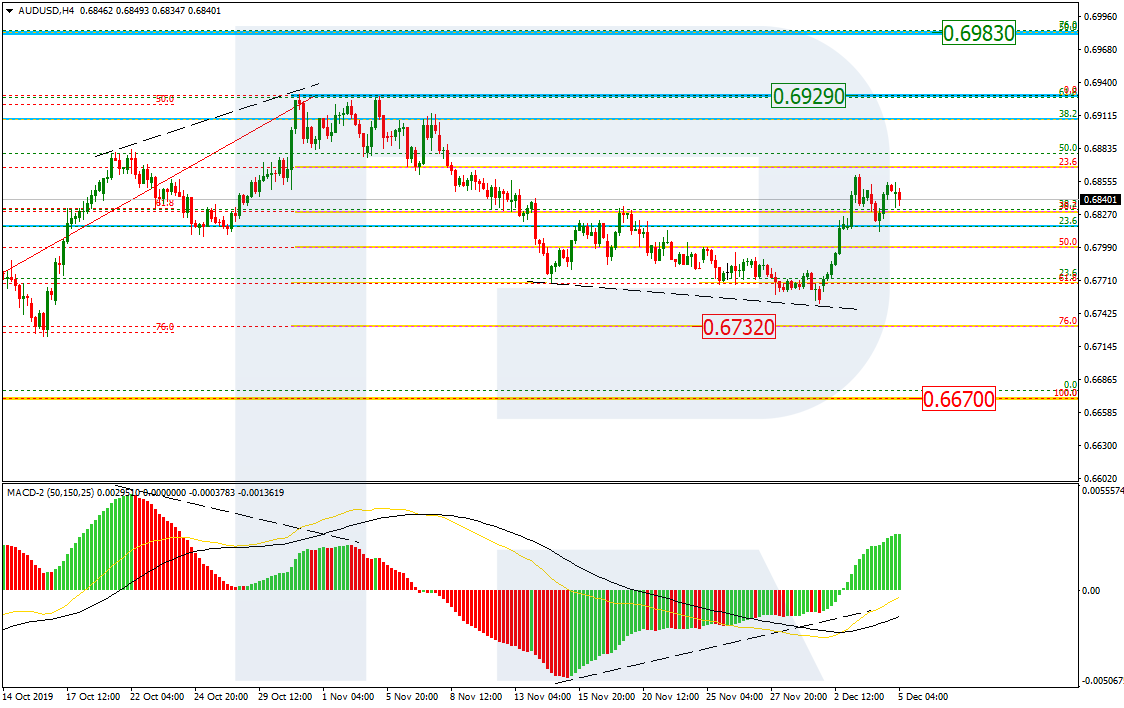
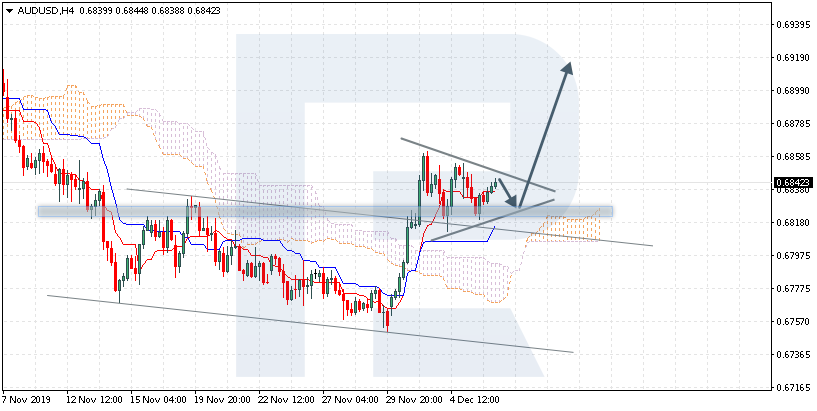
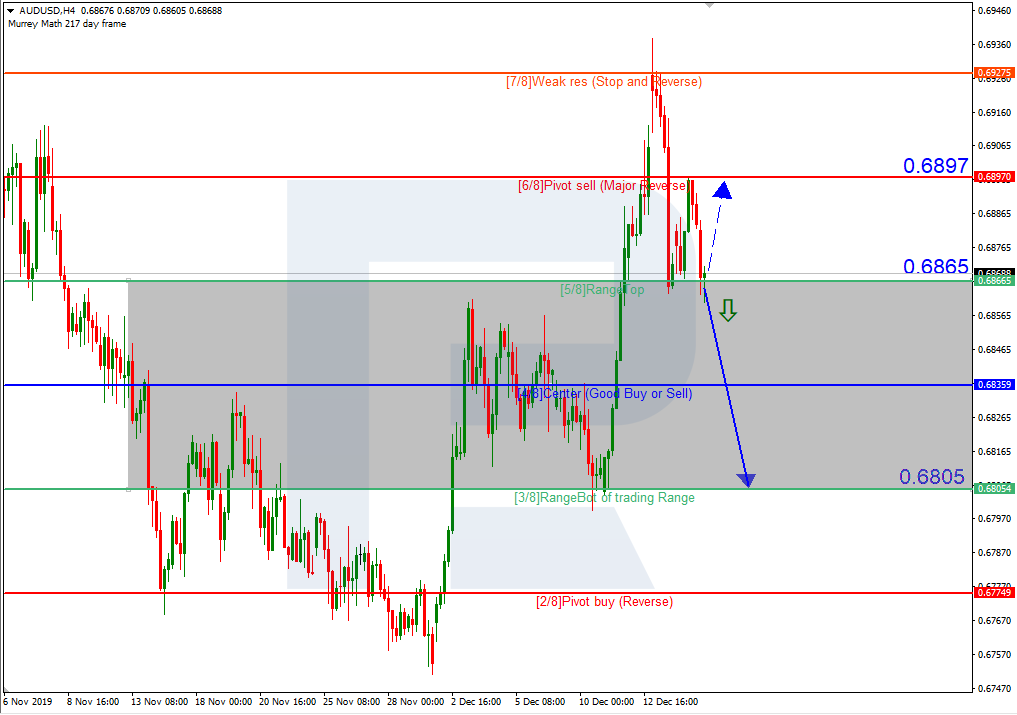
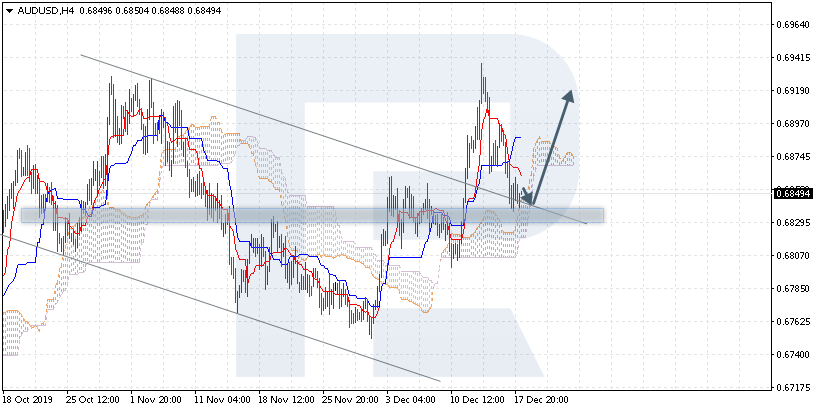
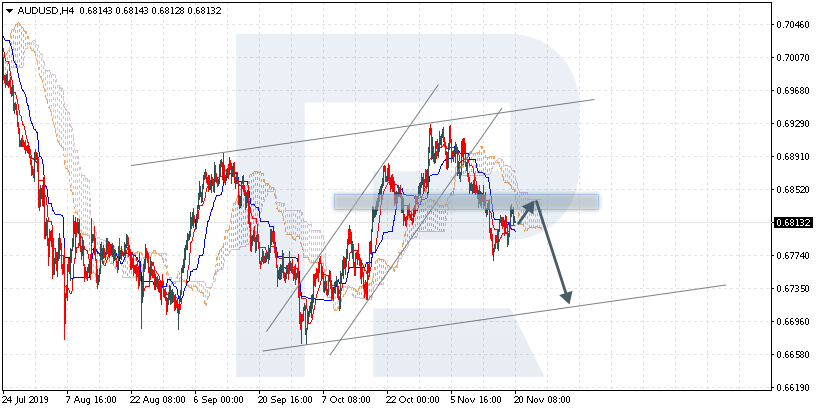
AUDUSD, “Australian Dollar vs US Dollar”
AUDUSD is trading at 0.6813; the instrument is moving below Ichimoku Cloud, thus indicating a descending tendency. The markets could indicate that the price may test the cloud’s upside border at 0.6825 and then resume moving downwards to reach 0.6725. Another signal to confirm further descending movement is the price’s rebounding from the resistance level. However, the scenario that implies further decline may be canceled if the price breaks the cloud’s upside border and fixes above 0.6875. In this case, the pair may continue growing towards 0.6965.
Read more - Ichimoku Cloud Analysis AUDUSD, NZDUSD, USDCAD