Topic: Risk Weighting a Collection of Strats
Hi guys. Before I get stuck in….what a great piece of software. Congrats Mr Popov.
I thought I would outline a possible approach that might be useful as an idea generator for future software enhancements in areas of portfolio management.
Each of us develop a methodology based on our underlying assumptions made about the markets. I tend to approach trading from a basis of risk management as that is the only area I have effective control over future outcomes. My search is therefore for the return streams that have the best risk-weighted return streams over as large a data sample as can be mustered.
The assumption in my quest is that markets are non-Gaussian in nature and that it is in the ‘fat tails’ where alpha resides. This philosophy therefore is based on a core principle of having robust systems ‘turned on’ all the time that can withstand market uncertainty and simply make hay while the sun shines….although I can never predict when this 'hay making' will occur.
The idea is that if your strategy can stand up against what the market throws at you and still produces a small edge….without compromising the overall portfolio….then you can use some secret sauce in portfolio management to ramp up returns to the moon through position sizing techniques.
In addition to strategy diversification, instrument diversification and timeframe diversification are also valuable contributors to managing correlation within the portfolio.
I use EA studio in the reactor mode to generate robust strategies that demonstrate an edge over an extended data set. Robustness is the key here and hence the MonteCarlo component works overtime on very high settings applied to strategy parameters over very long time series that include as many different market conditions that you can muster (eg GFC is essential). This results in the production of robust strategies that while being data mined….are unlikely to be highly ‘curve fit’ results.
Now it is very unlikely that each strategy is going to continue on performing as well as they did during in-sample testing as the return stream that you have mined through validation and any optimization in EA studio during in-sample testing is a single 'best case' probability result against a vast array of alternate 'more likely' return stream distributions. Ideally you want the more robust (median) return stream of the entire series of distributions produced by the MonteCarlo parameter array as opposed to the best result….but that is for another discussion.
Anyway…..here is how I apply the outputs of EA studio into my portfolio design.
I refer to the outputs of EA studio as the ‘raw’ outputs which then I treat in the MT4 tester environment.
I generate EA’s from EA studio and then place them in the MT4 environment and derive the trade results again on my brokers platform using MT4's Strategy Tester just to ensure that they still stack up. The exactness of the reproduced results is not the aim here…but rather that the derived results also have an edge and can maintain an excellent return to drawdown ratio in the brokers native environment.
I then convert performance metrics of Total % Return derived from EA Studio to Compound Annual Rates of Return (CAGR) as I tend to prefer to work with the MAR ratio as opposed to the return to Drawdown ratio as this ratio is used as a Fund management standard and also allow us to relatively rank return streams of a different test length. This way I combine strategies on H1 with a smaller test range with strategies on DH4 and D1 etc. with different test ranges based on available data.
The MAR ratio is like the Return to Drawdown ratio and is calculated as follows:
MAR = CAGR/Max Draw
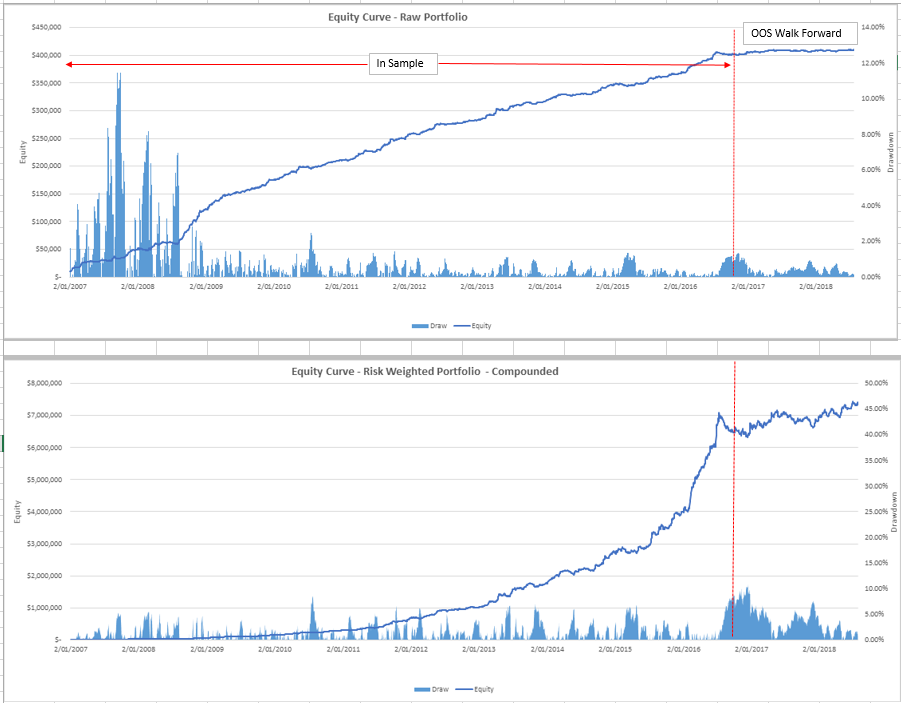
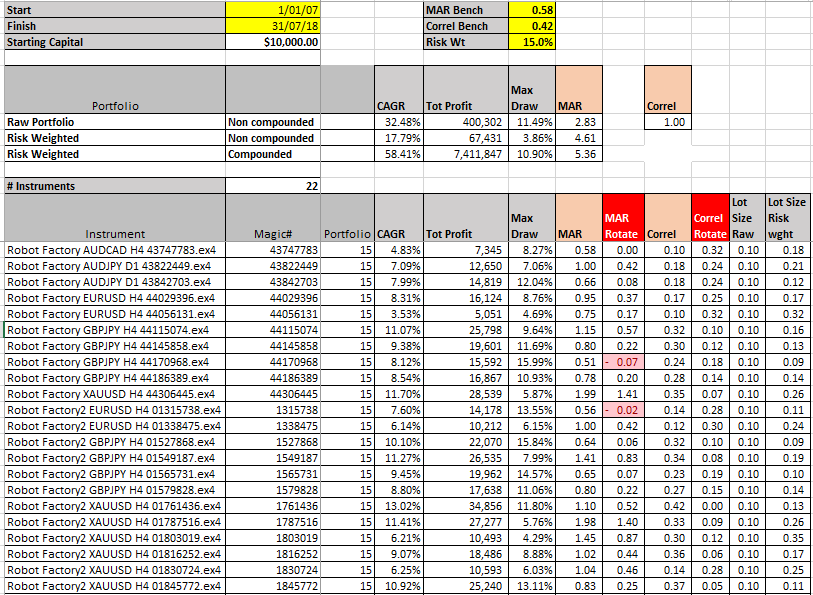
These raw results of each strategy are then compiled by summation into a Raw Portfolio result. In the attached example the Raw portfolio produces the following performance metrics:
1. CAGR = 32.48%
2. Max Draw = 11.19%
3. MAR ratio = 2.83
So now we can improve this result through applied position sizing treatments on the strategies contained in the portfolio.
STEP 1
EA studio produces a collection of strategies in the portfolio with a standard lot size. In this example a standard lot size of 0.10 lots.
To risk weight each strategy we apply the following formula to relatively scale each strategy in accordance with its inherent Volatility at Risk (VAR):
Inputs:
Raw strategy lot size = 0.10 lots
Raw strategy Max Draw Strategy A = 8.27%
Equally weighted desired risk weight = 15.0%
Adjusted Lot Size for Strategy A = 15.0/8.27 = 0.18 lot size
This is applied to each strategy in the portfolio collection.
After we have performed this risk weighting exercise the adjusted performance metrics of the example Risk-Weighted Portfolio are as follows:
1. CAGR = 17.79%
2. Max Draw = 3.86%
3. MAR ratio = 4.61
Do not be deceived by these results because on a risk weighted basis, this result is 1.6x more powerful than the raw portfolio (4.61/2.83).
STEP 2
Now we have risk weighted the portfolio we can now proceed to the portfolio ‘boost’ achieved by compounding the portfolio on a daily basis. In practice we simply look at the closing portfolio equity of the prior day (D-1) compared to the closing portfolio equity of the day before that (D-2) and multiply the increase/decrease in equity value to the rolling daily position size of each strategy.
Here is the result:
1. CAGR = 58.41%
2. Max Draw = 10.90%
3. MAR ratio = 5.36
So now compare and contrast this compounded result against the original raw portfolio result derived from EA studio.
1. CAGR = 32.48%
2. Max Draw = 11.19%
3. MAR ratio = 2.83
I hope this illustration helps for those that may be interested in augmenting their performance result produced from this excellent piece of software.
Below is a table that reflects how this process is managed on a daily basis and the resulting equity curves will be displayed on the next post.
Cheers
Richard