ats118765 wrote:Approximately 85% of the data in this phase will be OOS.
Rich
You mean 85 IS and 15 OOS?
Why don't you look OOS data separately? Why do you add the last 15% data for overall check-up? It is already established that all of those, which get tested in the 2nd phase, are "winners", so it only makes sense to check whether they are winners on the OOS part. Are you trying to say that 15% of data is too short for really assessing the trend-following edge? It is an interesting idea, hope you can explain it a bit more, usually OOS is looked separately.
The entire data range for the example is 1985.01.01 to say 2020.04.30
Phase 1) The data in which the EA is created in the reactor is say 2015.04.01 - 2020.04.30 = The dated range represents the In Sample part of the entire date range. (In sample = 15% of total data range). This is where the collections are created and honed for recent market conditions. This is also where it is possible to 'curve fit' the result.
Phase 2) The remaining data is used for validation only = 1985.01.01 - 2015.03.31 = OOS (85%). This is where the phase 1) collection is filtered to include only those survivors from Phase 1) that also exhibit robustness.
The result of both phases is a collection of :
1) Recent performers; AND
2) Survivors.
You validate across the entire data sample to generate an equity curve that gives both 'robust phases and 'recency phases' and plot regressions across the components to give 'future performance bounds' within which you oversee performance.
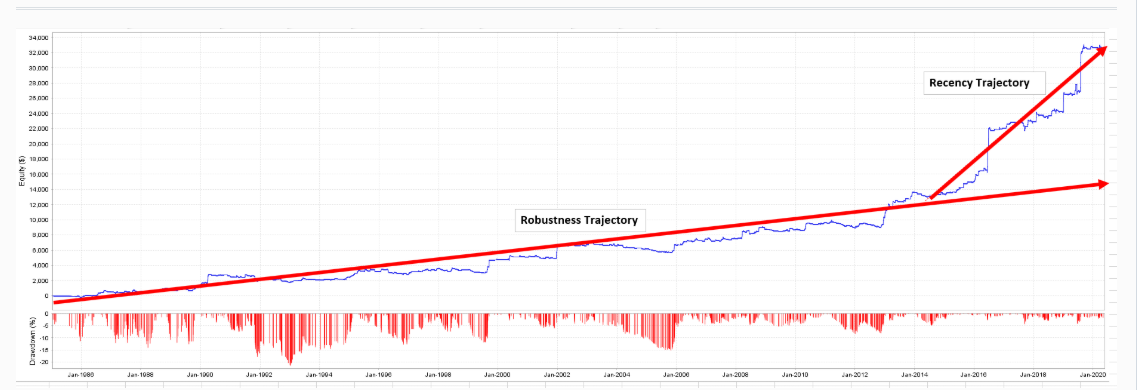
If future performance falls below the 'robustness projection', you replace the EA.
I find that there is inevitably a drop in performance when you take data mined EAs into the battlefield. This is understandable and to be expected however as future conditions are always slightly different from those market conditions in which the EAs were created. The problem however is that we just don't know whether the EAs are in a natural drawdown or are victims of curve fitting and have no enduring substance. This method plots logical bounds within which you manage the performance of your EAs.
Note: This process is only suggested for trend following models. Other methods require different robusness tools such as Monte Carlo and Walk Forward etc.
You only need a small in sample component to test whether your model is a trender or not. Most of the work is through the design process (eg. entry presets) plus stop and trailing stops. The data mining component (15%) is simply used to detect suitable parameters for the overall design that reflect 'more current market conditions' and are diversified options with a weak edge. The bulk of your test needs to be OOS (eg. 85%) to see how that solution stacks up over 'unfavourable' market conditions. This is to provide a degree of capital protection to your models.
How you then compile your diversified collection that have passed these tests is essential and where you need a compiler to examine correlations between the return streams.
]]>