<?xml version="1.0" encoding="utf-8"?>
<feed xmlns="http://www.w3.org/2005/Atom">
	<title type="html"><![CDATA[Forex Software — Differing Balance Charts in EA Studio]]></title>
	<link rel="self" href="https://forexsb.com/forum/feed/atom/topic/10091/" />
	<updated>2026-08-05T15:50:54Z</updated>
	<generator>PunBB</generator>
	<id>https://forexsb.com/forum/topic/10091/differing-balance-charts-in-ea-studio/</id>
		<entry>
			<title type="html"><![CDATA[Re: Differing Balance Charts in EA Studio]]></title>
			<link rel="alternate" href="https://forexsb.com/forum/post/83395/#p83395" />
			<content type="html"><![CDATA[<p>Yes that fixed it! I added a third stage to my process, where I rerun EG again to verify the acceptance criteria using 100% of the data (200,000 bars) and then import that collection into EA Studio (&quot;EAS&quot;). The EAS Balance Charts on the Strategy Editor tab now match the ones on the Collection tab. Problem solved. Thanks everyone!</p>]]></content>
			<author>
				<name><![CDATA[DrQuant]]></name>
				<uri>https://forexsb.com/forum/user/20381/</uri>
			</author>
			<updated>2026-08-05T15:50:54Z</updated>
			<id>https://forexsb.com/forum/post/83395/#p83395</id>
		</entry>
		<entry>
			<title type="html"><![CDATA[Re: Differing Balance Charts in EA Studio]]></title>
			<link rel="alternate" href="https://forexsb.com/forum/post/83394/#p83394" />
			<content type="html"><![CDATA[<div class="quotebox"><cite>Popov wrote:</cite><blockquote><p>You can compare the Express Generator data with the EA Studio data. <br />You can use either the short data stats in the Editor or the full stats in Data -&gt; Data Statistics</p></blockquote></div><p>Thank you for the tip. I was wondering how to do that!</p>]]></content>
			<author>
				<name><![CDATA[DrQuant]]></name>
				<uri>https://forexsb.com/forum/user/20381/</uri>
			</author>
			<updated>2026-08-05T14:39:17Z</updated>
			<id>https://forexsb.com/forum/post/83394/#p83394</id>
		</entry>
		<entry>
			<title type="html"><![CDATA[Re: Differing Balance Charts in EA Studio]]></title>
			<link rel="alternate" href="https://forexsb.com/forum/post/83393/#p83393" />
			<content type="html"><![CDATA[<div class="quotebox"><cite>yonkuro wrote:</cite><blockquote><p>I know Popov has already answered, but I just want to let you know, if you use maximum 40000 bars with data end at July 11 2026, you&#039;ll get the same result.</p></blockquote></div><p>Oh, I think you&#039;ve solved it! When I created the collection in Express Generator (&quot;EG&quot;) I employed a two-stage process. First I ran EG on 200,000 bars but only using 80% of the data (160,000 bars) as &quot;In Sample&quot;. Then I ran EG again for a second pass, using the last 20% of the data (40,000 bars) to confirm that the &quot;Out of Sample&quot; results met the criteria. As I understand it, this is the only way to do this. I then loaded the collection from the second pass into EA Studio (&quot;EAS&quot;).</p><p>What I didn&#039;t realise is that the Balance Charts for the collection from the second pass would only be showing the last 40,000 bars! Then, when I select an EA from that collection the chart would instantly switch to showing all 200,000 bars. That explains the sudden and very dramatic change in the charts!</p><p>Thank you yonkuro for figuring this out. I feel much better now I understand this!</p>]]></content>
			<author>
				<name><![CDATA[DrQuant]]></name>
				<uri>https://forexsb.com/forum/user/20381/</uri>
			</author>
			<updated>2026-08-05T14:38:12Z</updated>
			<id>https://forexsb.com/forum/post/83393/#p83393</id>
		</entry>
		<entry>
			<title type="html"><![CDATA[Re: Differing Balance Charts in EA Studio]]></title>
			<link rel="alternate" href="https://forexsb.com/forum/post/83392/#p83392" />
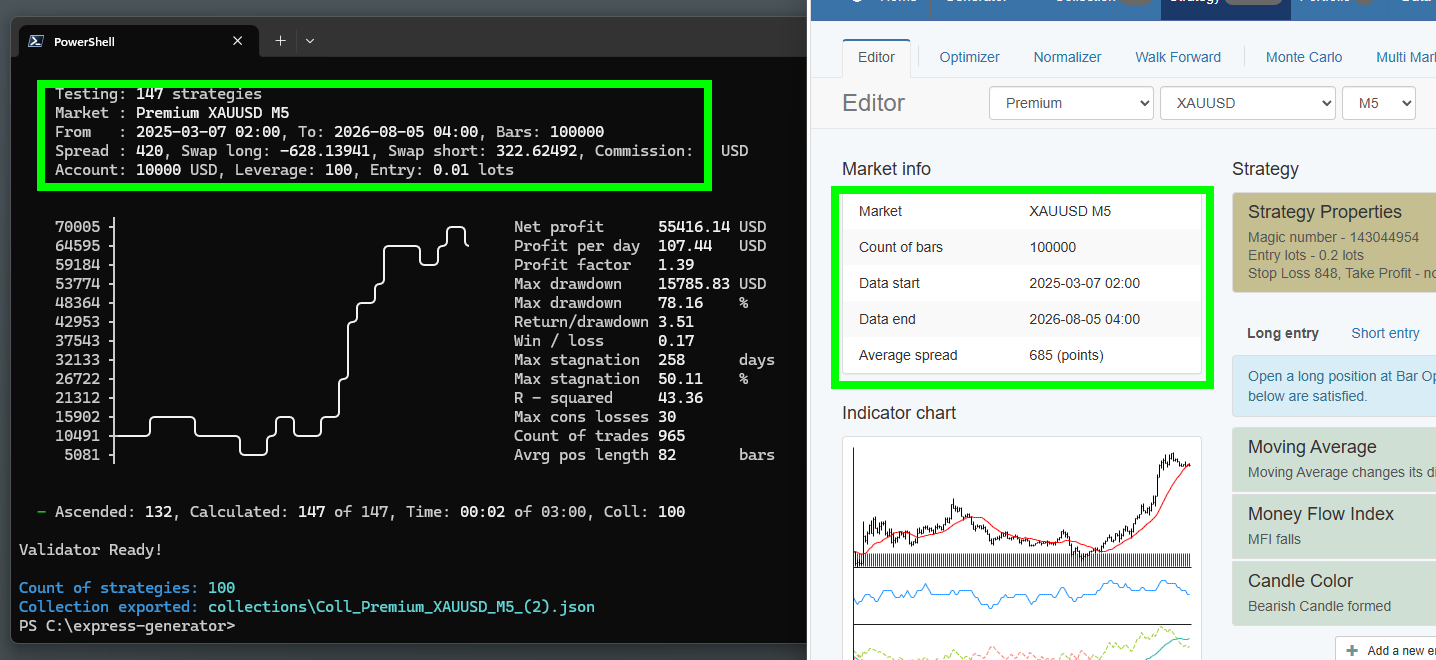
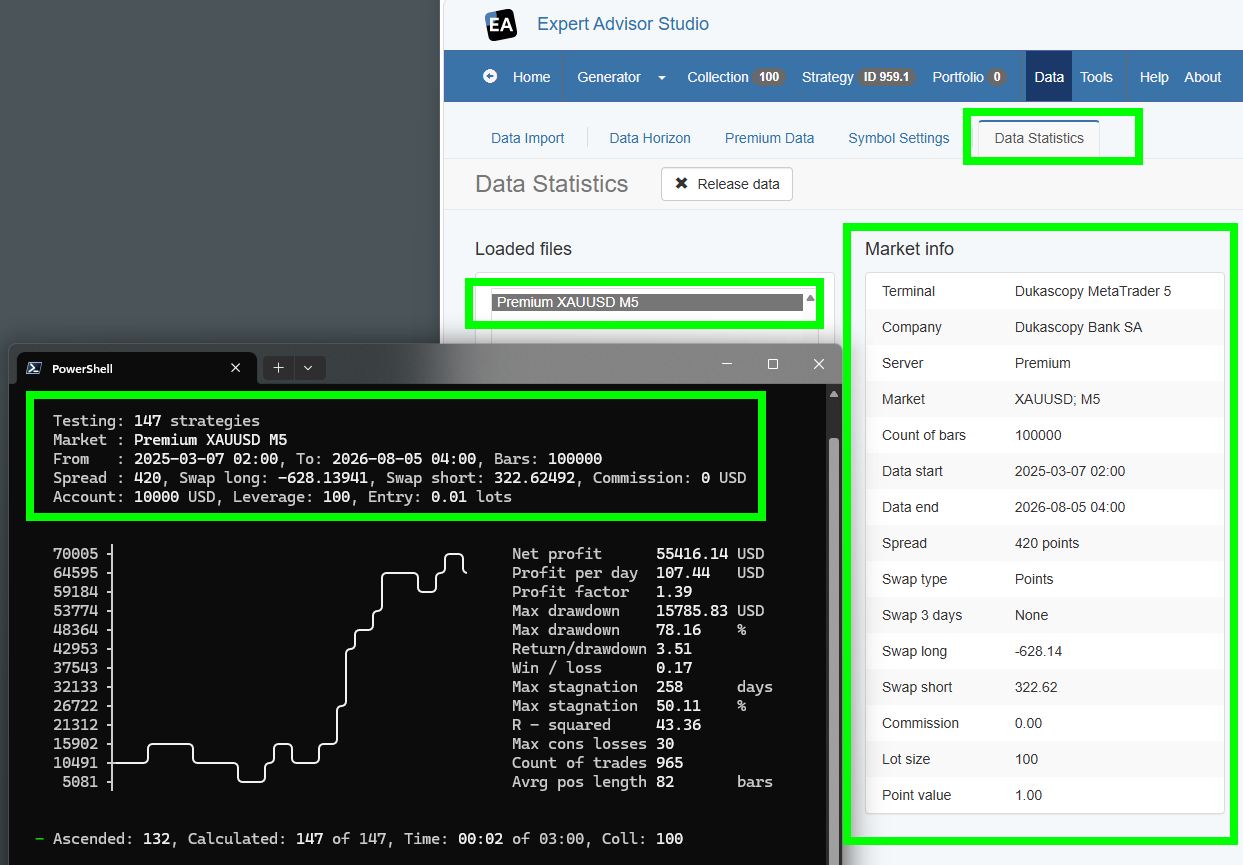
			<content type="html"><![CDATA[<p>You can compare the Express Generator data with the EA Studio data. <br />You can use either the short data stats in the Editor or the full stats in Data -&gt; Data Statistics</p><p><a href="https://image-holder.forexsb.com/store/ex-gen-to-ea-studio-comparing-markets.png"><span class="postimg"><img src="https://image-holder.forexsb.com/store/ex-gen-to-ea-studio-comparing-markets-thumb.png" alt="https://image-holder.forexsb.com/store/ex-gen-to-ea-studio-comparing-markets-thumb.png" /></span></a></p><p><a href="https://image-holder.forexsb.com/store/ex-gen-to-ea-studio-comparing-markets-stats.png"><span class="postimg"><img src="https://image-holder.forexsb.com/store/ex-gen-to-ea-studio-comparing-markets-stats-thumb.png" alt="https://image-holder.forexsb.com/store/ex-gen-to-ea-studio-comparing-markets-stats-thumb.png" /></span></a></p>]]></content>
			<author>
				<name><![CDATA[Popov]]></name>
				<uri>https://forexsb.com/forum/user/2/</uri>
			</author>
			<updated>2026-08-05T04:51:32Z</updated>
			<id>https://forexsb.com/forum/post/83392/#p83392</id>
		</entry>
		<entry>
			<title type="html"><![CDATA[Re: Differing Balance Charts in EA Studio]]></title>
			<link rel="alternate" href="https://forexsb.com/forum/post/83391/#p83391" />
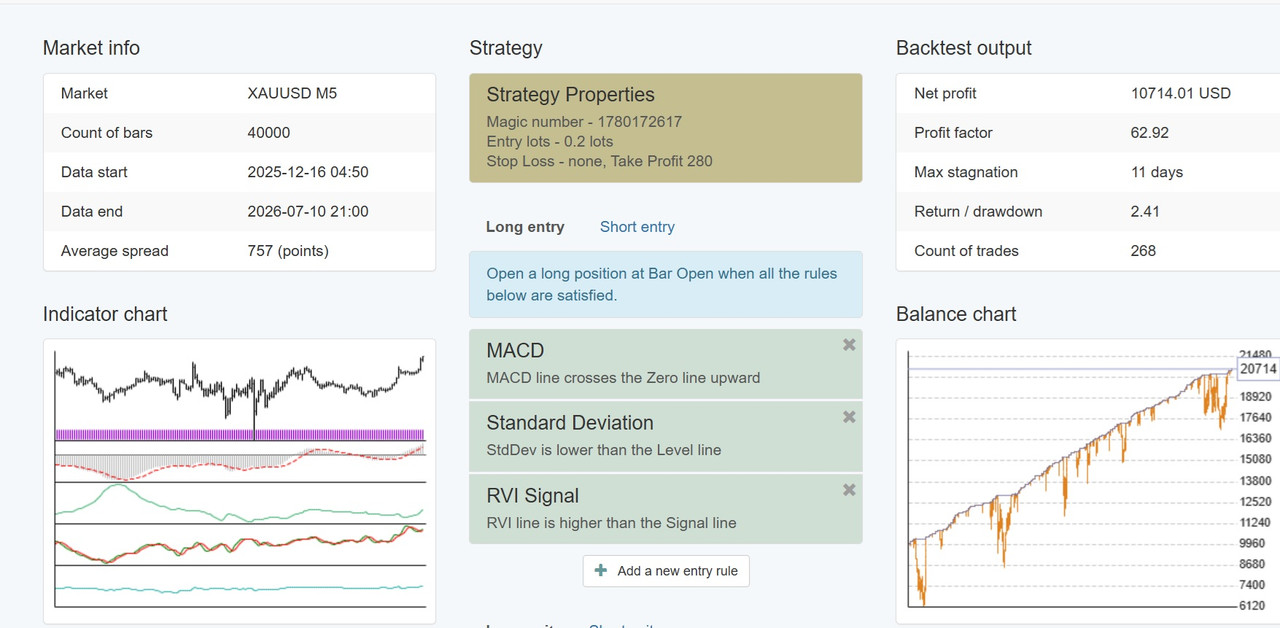
			<content type="html"><![CDATA[<div class="quotebox"><cite>DrQuant wrote:</cite><blockquote><p>Okay thanks!</p><p>I used Premium data with 200,000 bars for both Express Generator and EA Studio... but the start date may have been different. I will check...</p></blockquote></div><p>Hello DrQuant</p><p>I know Popov has already answered, but I just want to let you know, if you use maximum 40000 bars with data end at July 11 2026, you&#039;ll get the same result.</p><p><a href="https://postimg.cc/0z9m9Hp0"><span class="postimg"><img src="https://i.postimg.cc/RZHTQkhy/SS-04082026.jpg" alt="https://i.postimg.cc/RZHTQkhy/SS-04082026.jpg" /></span></a></p>]]></content>
			<author>
				<name><![CDATA[yonkuro]]></name>
				<uri>https://forexsb.com/forum/user/8447/</uri>
			</author>
			<updated>2026-08-04T15:24:15Z</updated>
			<id>https://forexsb.com/forum/post/83391/#p83391</id>
		</entry>
		<entry>
			<title type="html"><![CDATA[Re: Differing Balance Charts in EA Studio]]></title>
			<link rel="alternate" href="https://forexsb.com/forum/post/83390/#p83390" />
			<content type="html"><![CDATA[<p>Okay thanks!</p><p>I used Premium data with 200,000 bars for both Express Generator and EA Studio... but the start date may have been different. I will check...</p>]]></content>
			<author>
				<name><![CDATA[DrQuant]]></name>
				<uri>https://forexsb.com/forum/user/20381/</uri>
			</author>
			<updated>2026-08-04T13:48:55Z</updated>
			<id>https://forexsb.com/forum/post/83390/#p83390</id>
		</entry>
		<entry>
			<title type="html"><![CDATA[Re: Differing Balance Charts in EA Studio]]></title>
			<link rel="alternate" href="https://forexsb.com/forum/post/83389/#p83389" />
			<content type="html"><![CDATA[<p>&gt; By the way, I think your EA tools are great. You&#039;ve done a fantastic job.</p><p>Thank you!</p><p>&gt; The problem is that in EA Studio when I click on an EA from the collection the Balance Chart in the Strategy Editor tab is different from the Balance Chart in the Collection tab.</p><p>When the strategy loads in the Editor, EA Studio recalculates it. It will shows different results only if the data are different (newer) or the EA Settings are different.</p><p>The first time you load a Collection from a file (from Ex Gen or previously exported from EA Studio) it is shown as it is, without calculation. The Collection file includes the backtest stats and the balance chart data for each strategy. That give the possibility to show it as it was exported before.</p><p>You can recalculate the Collection with the recent data and the current settings by clicking the &quot;Recalculate&quot; button.<br />Once you recalculate the Collection, it will show exactly the same results in the Editor.</p><p>Most probably your Collection was calculated and exported from Ex. Gen from data with different &quot;Data horizon&quot; settings or different &quot;Trading Session&quot; settings. This is the only possible explanation. (If there is no bug somewhere).</p><p>...</p><p>The Collection&#039;s &quot;Recalculate&quot; function and the Editor use the same data set, settings, and backtester engine. I don&#039;t assume it is possible to have different results. (Though you may filter and reorder the strategies in the Collection, but this is different).</p>]]></content>
			<author>
				<name><![CDATA[Popov]]></name>
				<uri>https://forexsb.com/forum/user/2/</uri>
			</author>
			<updated>2026-08-04T11:12:40Z</updated>
			<id>https://forexsb.com/forum/post/83389/#p83389</id>
		</entry>
		<entry>
			<title type="html"><![CDATA[Re: Differing Balance Charts in EA Studio]]></title>
			<link rel="alternate" href="https://forexsb.com/forum/post/83388/#p83388" />
			<content type="html"><![CDATA[<p>Thanks Miroslav but I don&#039;t think that addresses the problem I raised. I never said that the collections are different. The problem is that in EA Studio when I click on an EA from the collection the Balance Chart in the Strategy Editor tab is different from the Balance Chart in the Collection tab. My guess was that this has something to do with the collection coming from Express Generator but I could be wrong. When you select an EA from your collection is the Balance Chart in the Strategy Editor the same as the Balance Chart in the Collection tab?</p><p>By the way, I think your EA tools are great. You&#039;ve done a fantastic job.</p>]]></content>
			<author>
				<name><![CDATA[DrQuant]]></name>
				<uri>https://forexsb.com/forum/user/20381/</uri>
			</author>
			<updated>2026-08-04T08:19:36Z</updated>
			<id>https://forexsb.com/forum/post/83388/#p83388</id>
		</entry>
		<entry>
			<title type="html"><![CDATA[Re: Differing Balance Charts in EA Studio]]></title>
			<link rel="alternate" href="https://forexsb.com/forum/post/83387/#p83387" />
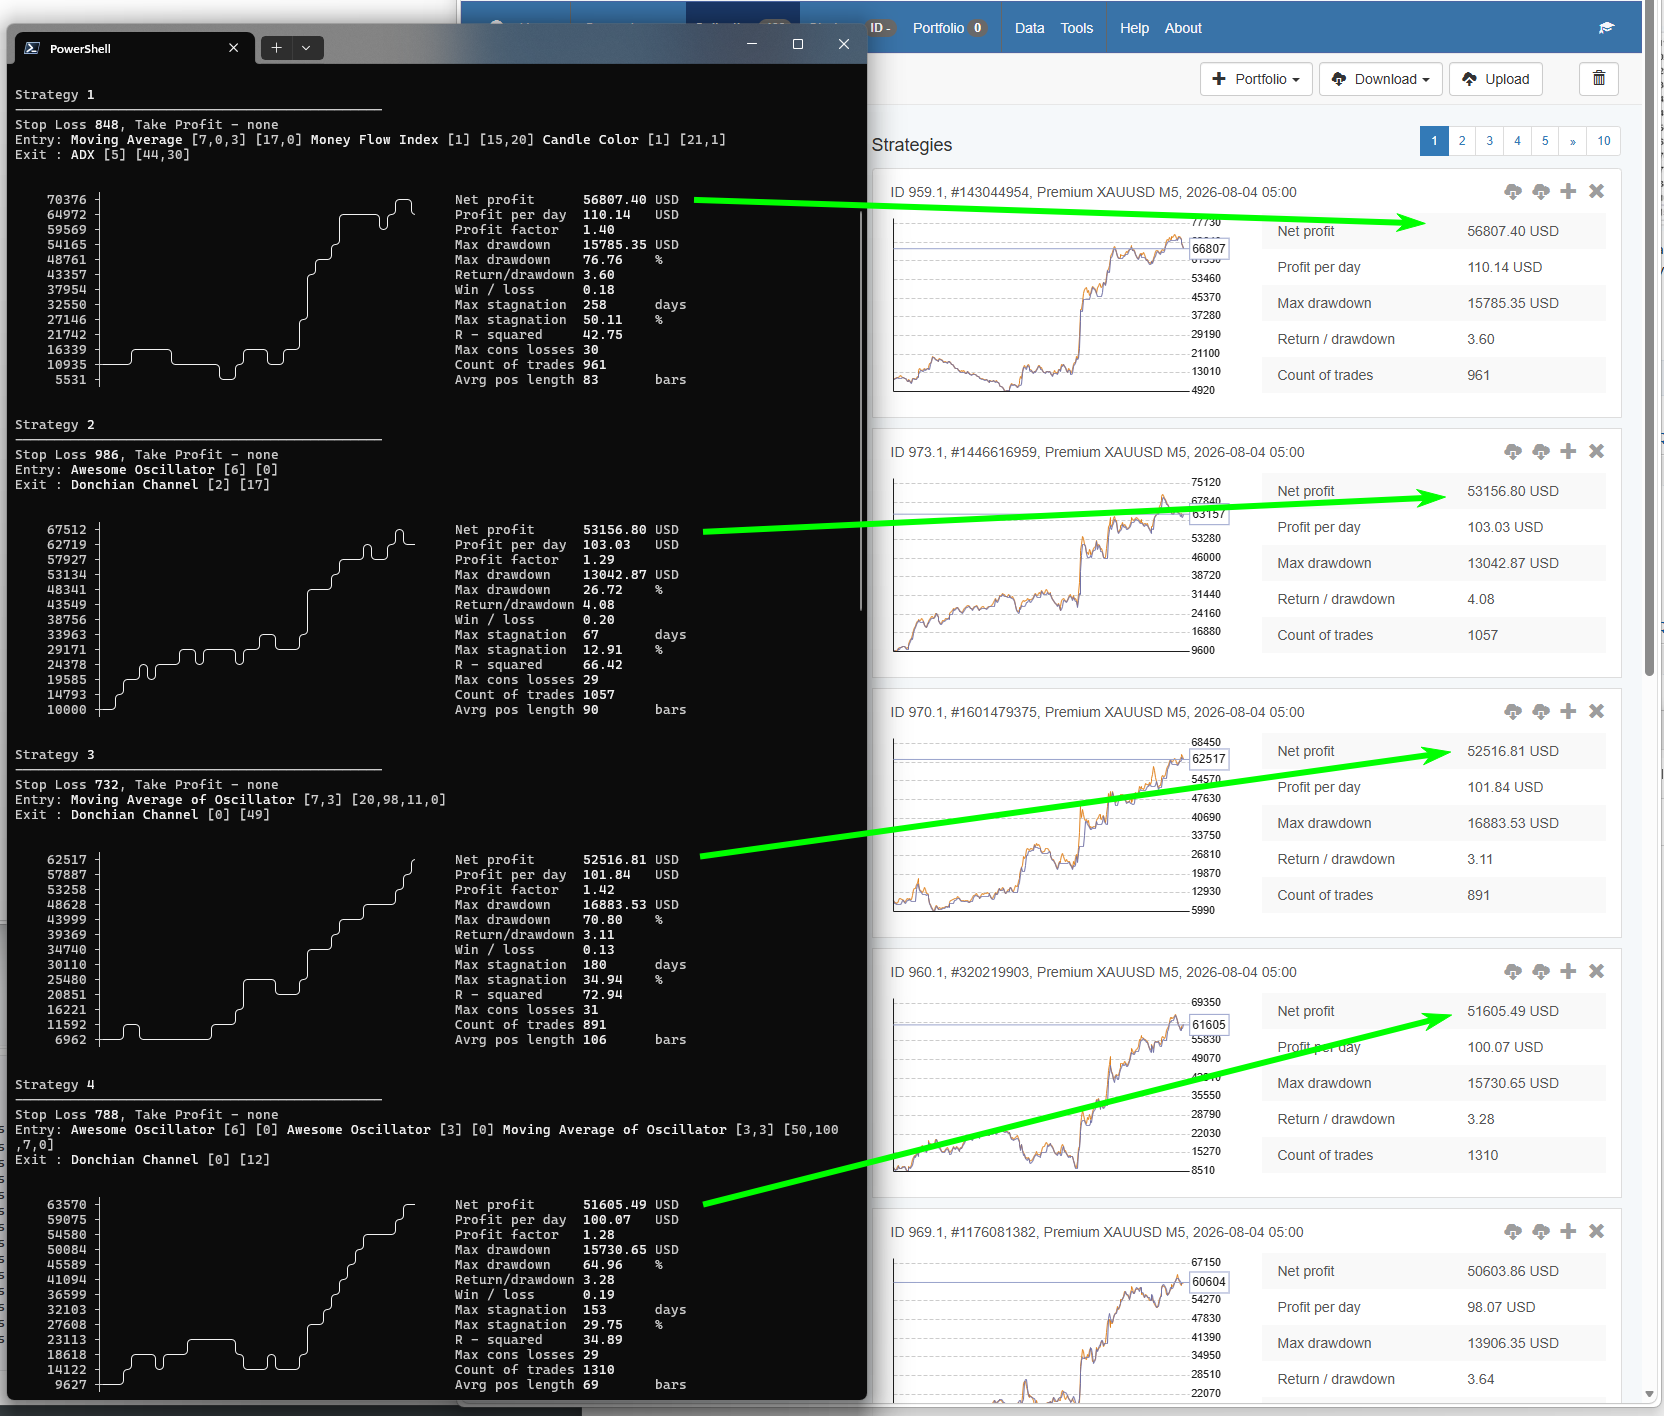
			<content type="html"><![CDATA[<p>I&#039;m doing my best to make both EA Studio and Express Generator reliable.</p><p>I recalculated your collection in both tools and received the same results (on the second try <img src="https://forexsb.com/forum/img/smilies/smile.png" width="15" height="15" alt="smile" /> )</p><p><a href="https://image-holder.forexsb.com/store/ex-gen-to-ea-studio-comparing-results.png"><span class="postimg"><img src="https://image-holder.forexsb.com/store/ex-gen-to-ea-studio-comparing-results-thumb.png" alt="https://image-holder.forexsb.com/store/ex-gen-to-ea-studio-comparing-results-thumb.png" /></span></a></p><p>How to compare results:<br /> - check if both programs have the same settings<br /> - update the forex rates, symbol info and the data series in Express Generator and reload EA Studio.<br /> - run express generator with &quot;--input ./collection/My-collection-AAA.json&quot;<br /> - import and recalculate the collection in EA Studio.</p><p>How I tested it:<br /> - reset the EA Studio settings and run Ex. Gen with the default settings for the test.<br /> - update the Fx rates and the symbol info (I forgot to do it in the first try and received slightly different results)<br /> - using &quot;--show-top 10&quot; to print out the calculated strategies in the terminal.</p><p>My full command was:</p><div class="codebox"><pre><code>&gt; node .\bin\fetch.js --server Premium --symbol XAUUSD --period M5 --max-data-bars 100000 --fx-rates true --symbol-info true

&gt; node .\bin\gen.js --server Premium --symbol XAUUSD --period M5 --max-data-bars 100000 --input .\collections\Coll_Premium_XAUUSD_M5.json --show-top 10</code></pre></div><p>...</p><p>I have a mean to test Ex. Gen vs EA Studio. I&#039;m using a special build that runs Ex Gen for 10 strategies, then recalculate them in EA Studio and compare the results automatically. I run this in a loop for 100k strategies when updating the indicators or the backtester to be sure everything is ok.</p>]]></content>
			<author>
				<name><![CDATA[Popov]]></name>
				<uri>https://forexsb.com/forum/user/2/</uri>
			</author>
			<updated>2026-08-04T06:50:39Z</updated>
			<id>https://forexsb.com/forum/post/83387/#p83387</id>
		</entry>
		<entry>
			<title type="html"><![CDATA[Re: Differing Balance Charts in EA Studio]]></title>
			<link rel="alternate" href="https://forexsb.com/forum/post/83386/#p83386" />
			<content type="html"><![CDATA[<p>Seems like data is different! Am I seeing correctly that the chart on the right has only a couple of trades?</p>]]></content>
			<author>
				<name><![CDATA[footon]]></name>
				<uri>https://forexsb.com/forum/user/1242/</uri>
			</author>
			<updated>2026-08-03T18:35:46Z</updated>
			<id>https://forexsb.com/forum/post/83386/#p83386</id>
		</entry>
		<entry>
			<title type="html"><![CDATA[Re: Differing Balance Charts in EA Studio]]></title>
			<link rel="alternate" href="https://forexsb.com/forum/post/83385/#p83385" />
			<content type="html"><![CDATA[<p>If this is the reason the balance chart is different, what do I need to do in EA Studio to get the same balance chart that I got from Express Generator?</p>]]></content>
			<author>
				<name><![CDATA[DrQuant]]></name>
				<uri>https://forexsb.com/forum/user/20381/</uri>
			</author>
			<updated>2026-08-03T16:08:32Z</updated>
			<id>https://forexsb.com/forum/post/83385/#p83385</id>
		</entry>
		<entry>
			<title type="html"><![CDATA[Re: Differing Balance Charts in EA Studio]]></title>
			<link rel="alternate" href="https://forexsb.com/forum/post/83384/#p83384" />
			<content type="html"><![CDATA[<p>Attached is the collection.</p>]]></content>
			<author>
				<name><![CDATA[DrQuant]]></name>
				<uri>https://forexsb.com/forum/user/20381/</uri>
			</author>
			<updated>2026-08-03T15:39:38Z</updated>
			<id>https://forexsb.com/forum/post/83384/#p83384</id>
		</entry>
		<entry>
			<title type="html"><![CDATA[Re: Differing Balance Charts in EA Studio]]></title>
			<link rel="alternate" href="https://forexsb.com/forum/post/83383/#p83383" />
			<content type="html"><![CDATA[<p>Not sure if it&#039;s important, but the collection was created by Express Generator...</p>]]></content>
			<author>
				<name><![CDATA[DrQuant]]></name>
				<uri>https://forexsb.com/forum/user/20381/</uri>
			</author>
			<updated>2026-08-03T15:33:04Z</updated>
			<id>https://forexsb.com/forum/post/83383/#p83383</id>
		</entry>
		<entry>
			<title type="html"><![CDATA[Differing Balance Charts in EA Studio]]></title>
			<link rel="alternate" href="https://forexsb.com/forum/post/83382/#p83382" />
			<content type="html"><![CDATA[<p>Hi all,</p><p><a href="https://postimages.org/"><span class="postimg"><img src="https://i.postimg.cc/52x3bF6F/Capture.jpg" alt="https://i.postimg.cc/52x3bF6F/Capture.jpg" /></span></a></p><p>This might have been asked before but I couldn&#039;t find any info when I searched the forum. In the &quot;Collection&quot; tab I see the balance chart on the left of the image above (Premium data, XAUUSD, M5, 200k bars). But when I open that EA in the Editor (&quot;Strategy&quot; tab) I see the balance chart on the right of the image above. Why did it change? </p><p>I&#039;ve attached the EA in case you want to test it yourself.</p><p>Thanks!</p>]]></content>
			<author>
				<name><![CDATA[DrQuant]]></name>
				<uri>https://forexsb.com/forum/user/20381/</uri>
			</author>
			<updated>2026-08-03T12:00:44Z</updated>
			<id>https://forexsb.com/forum/post/83382/#p83382</id>
		</entry>
</feed>