Keltner Channel
Keltner Channel is volatility-based price envelopes placed above and below an exponential moving average and is similar to the Bollinger Bands. The channel lines are set two Average True Ranges (ATR) above and below the 20-period EMA (for the Bollinger Bands is used the standard deviation). This is a trend following indicator and could be used to identify reversals as well as overbought and oversold conditions when the the market is in consolidation. Close above the upper line as a strong bullish signal, while a close below the lower line is strong bearish signal. Trend is confirmed by the direction of the lines of the Keltner Channel. Distance between the lines is showing the market volatility measured by the ATR.
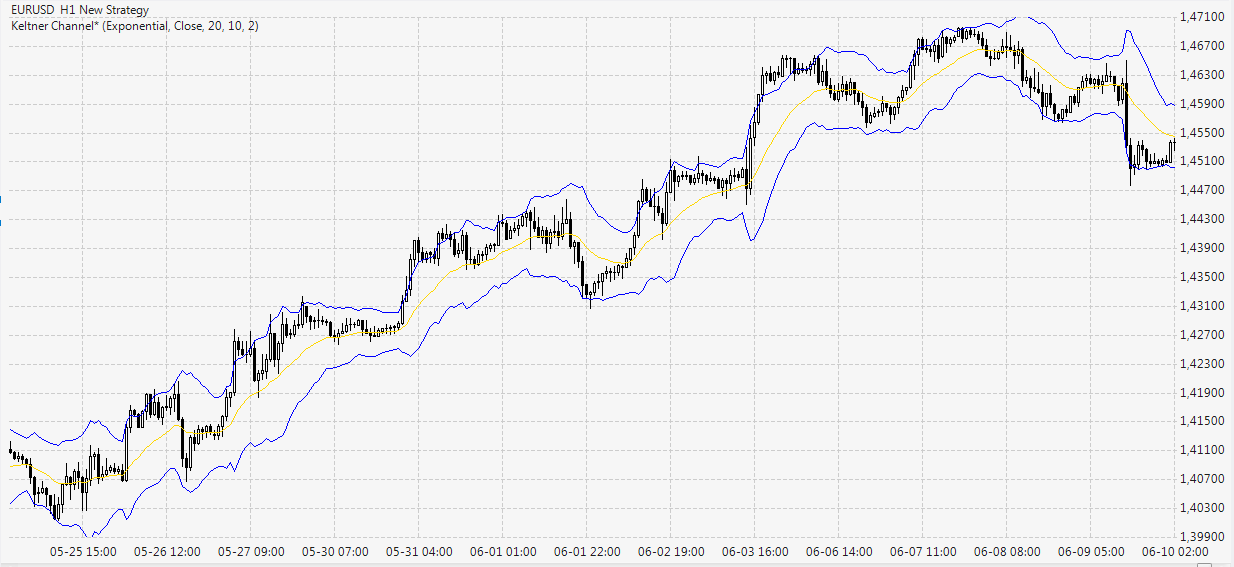
The overlays on the chart above are the following:
- Middle Line (yellow): 20-hour exponential moving average
- Upper Channel Line (blue): 20-hour EMA + (2 x ATR(10))
- Lower Channel Line (blue): 20-hour EMA - (2 x ATR(10))