Ichimoku Clouds
The Ichimoku Cloud is a technical indicator that identifies the trend and its direction, defines support and resistance levels, measures the price momentum and could be used as a trading system. In Japanese it is called Ichimoku Kinko Hyo and means “one look equilibrium chart”. This indicator consists of the following five lines:
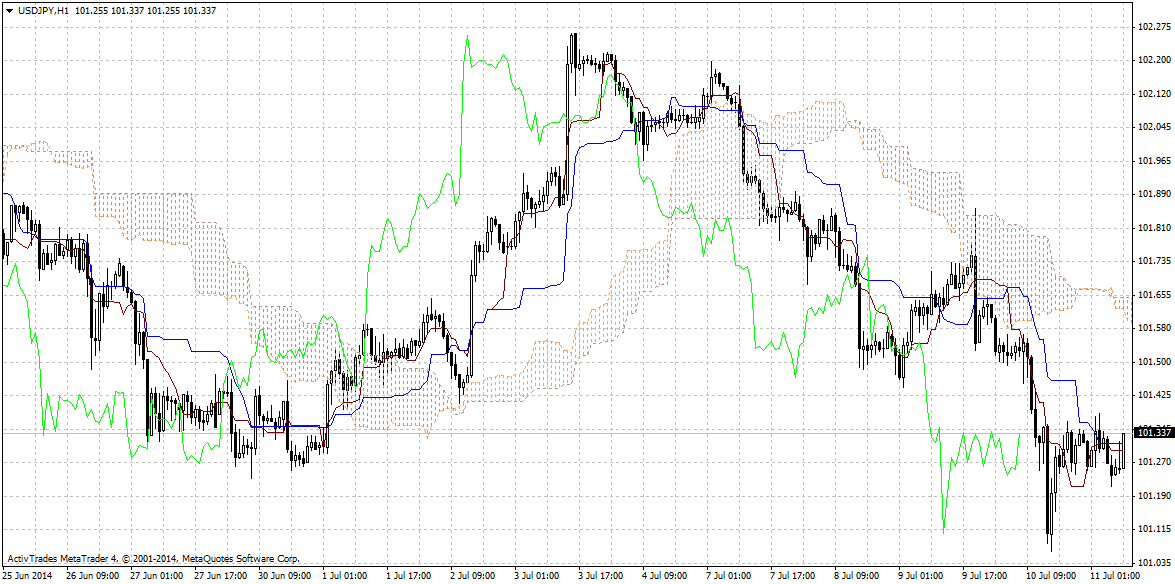
Conversion Line (Tenkan-sen) is (9-period high + 9-period low)/2)
Base Line (Kijun-sen) is (26-period high + 26-period low)/2))
Leading Span A (Senkou Span A) is (Conversion Line + Base Line)/2))
Leading Span B (Senkou Span B) is (52-period high + 52-period low)/2))
Lagging Span (Chikou Span) is Close plotted 26 days in the past
The Cloud (Kumo) is the space between the Senkou Span A and B.
The Conversion Line is the fastest and most sensitive line, while the Base Line trails the faster Conversion Line. The relationship between the Conversion Line and Base Line is similar to the relationship between a 9-day and 26-day moving average. The cloud boundaries define the support and resistance levels. The Kumo cloud changes in shape and height based on price changes. This height represents volatility as larger price movements form thicker clouds, which creates a stronger support and resistance. Generally, market sentiment is bullish when Senkou Span A is above Senkou Span B and it is bearish when Senkou Span A is below Senkou Span B. When Senkou Span A and B cross, this could be a signal of potential trend reversals. The angle of the cloud also shows the direction of the trend. When it points upwards the trend is bullish, while when it points downwards the trend is bearish.