Fibonacci Retracements
Fibonacci retracements are horizontal lines that indicate possible support or resistance areas at the key Fibonacci levels. These levels are created by dividing the vertical distance between a swing high and a swing low by the key Fibonacci ratios of 23.6%, 38.2%, 50%, 61.8% and 100%. These ratios are based on the number sequence identified by the Italian mathematician Leonardo Fibonacci centuries ago. The Fibonacci sequence of numbers is as follows: 0, 1, 1, 2, 3, 5, 8, 13, 21, 34, 55, 89, 144, etc. and each number in this sequence is the sum of the two previous numbers. Each number of the sequence is approximately 1.618 times greater than the preceding one. The key Fibonacci ratio of 61.8% (also known as “the golden ratio”) is derived by dividing one number in the series by the number that follows it.
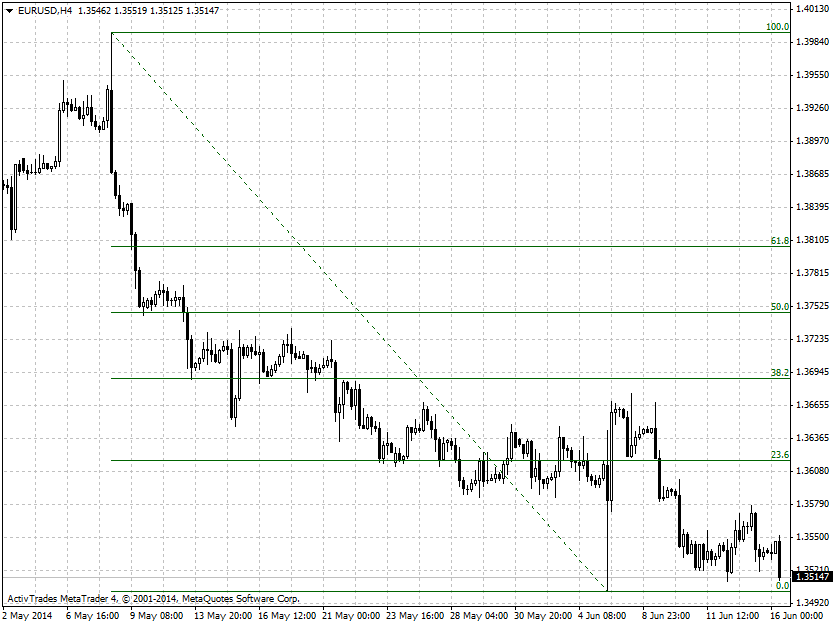
When the Fibonacci retracement levels are plotted on the chart it could be expected that the pullbacks during a trend will end around these support or resistance areas. You can plot Fibonacci levels based on various swing highs and lows and look of areas of confluence. I don't base my trading decisions solely on Fibonacci retracements and prefer to use them only for confirmation of buy or sell set ups.